Bubbles are followed by echo-bubbles, and the bursting of the second bubble ends the speculative cycle.
If we have learned anything in the past 20 years of massive asset bubbles and equally massive declines when the bubbles finally pop, it's this: those caught up in the expansionary phase of the bubble cannot believe the bubble that's rewarding them so richly could actually burst.
This psychology of mass delusion now dominates housing, stocks and bonds: not only is this not a bubble, the expansion will continue forever.
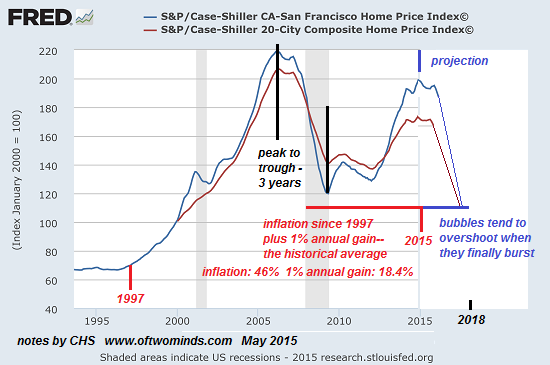
History, however, suggests otherwise: all bubbles burst, period. With that in mind, I've made a few notes on a chart of the Case-Shiller Home Price Index. This chart displays both the nation Case-Shiller index and the San Francisco Bay Area index.
Over the long-term, housing has tended to rise about 1% annually above inflation. According to the Bureau of labor Statistics, $1 in pre-bubble 1997 is $1.46 in 2015 dollars. A 1% gain over the past 17 years adds 18.4%. If we add inflation and a 1% annual gain, we find a historically justified target around 110 on the Case-Shiller index.
One of the more striking characteristics of bubbles is their symmetry: if the expansionary phase took 3 years, the bursting phase also takes around 3 years to complete.
The last housing bubble took about 3 years from peak to trough, and this provides a baseline projection for the decline of the current housing bubble, which is shaping up as a classic echo-bubble: very much like the previous bubble, but of slightly lower magnitude.
The projected decline over the next three years to the 110 level is the best-case scenario. Analyst Mark Hanson made a very persuasive case for a much sharper drop when the current housing bubble pops: here.
In essence, Hanson suggests that the narrow base of the current bubble expansion--all cash buyers (speculators, private-equity funds, overseas oligarchs and corrupt officials, etc.) and marginal borrowers relying on highly leveraged FHA and VA mortgages--will collapse much quicker than the previous bubble, which was inflated by a much larger base of market participants.
Bubbles also have a habit of overshooting when they finally burst. the Federal Reserve acted quickly to re-inflate the housing bubble by lowering interest rates to near-zero and buying over $1 trillion of mortgage-backed securities. Given the narrow base of the current bubble, these tricks will not work should the Fed attempt to inflate Housing Bubble 3.0.
In general, bubbles are followed by echo-bubbles, and the bursting of the second bubble ends the speculative cycle. There is no fundamental reason why housing could not round-trip to levels well below 100 on the Case-Shiller Index when the current bubble finally bursts.
If Mark Hanson's analysis is prescient, it may not require 3 years for the current housing bubble to implode; 2 years (2017) might be more than enough time for the speculative excesses to evaporate.
As I have noted before, when the herd turns, risk-on bids disappear, and the bottom drops out of the market much faster than participants believe is possible.
