Good afternoon, dear traders and investors. Today we return to the London Wheat/F-CATTLE (wheat vs. frozen beef), composed by the PCI GeWorko.
The significant decline in the Wheat prices in the period from September to February of this year led to the fact that the share of the crop became consumed as cattle fodder (feed wheat). This allowed stimulating the growth in beef stocks and the projected demand in the market. As a consequence the WHEAT/F-CATTLE PCI shows an increase from the beginning of February. The temporary correction is completed due to the worsening political situation in Ukraine. Financing of farms fell due to reduction in government spending, which was a lending condition of the IMF and EU. On the other hand, the harvest in Punjabi (the agricultural district of India ) was 7-10 days delayed due to elections and the long cold weather period. Further delays are possible due to bad weather conditions. We should not forget about the drought in Russia this year as the Wheat harvest forecast in Russia has been adjusted by 1.8 million tons to 48.1 million tons. Thus, we should expect the negative sentiment in the market and the speculative Wheat growth before the grain harvest ends. We will try to find some market entry points for opening a long position by the WHEAT/F-CATTLE.
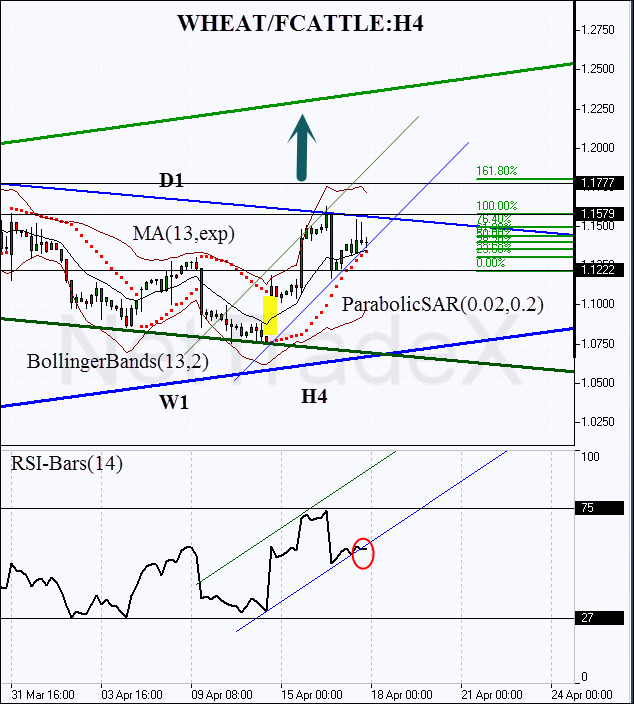
Here we consider the H4 chart, in the NetTradeX trading platform. At the moment, the market situation provides the opportunities to buy, as it follows from the figure.

On April 15th, after the publication of the forecast for wheat stocks by Agritel, the price jumped up, forming a bullish gap, which set the tone for a new trend. Straight after that, the price tested the top of the Bollinger Bands(13,2) channel and now it is still drifting above the exponential moving average MA(13,exp). The ParabolicSAR(0.02,02) confirms the bullish trend. The RSI(13) also shows the uptrend, but the support line breakthrough looks alarming. Before opening a long position, we would wait the oscillator value to return in the rising channel. It would be wise to make sure the breakthrough is false.
We would expect the resistance level to be crossed by the price around 1.1579. We will place a pending buy order at this level. If breakdown occurs, we can talk about the daily trend completion. The target is to be set below the historic highs and below the first Fibonacci level of 161.8%, around 1.1777. The risk limitation level naturally corresponds to the last minimum.
We emphasize that the High/Low quotes for PCI instruments are model, so we use and recommend You to use the Close/Open price to determine the support/resistance levels, in other words, boundaries of candle bodies. It should also be borne in mind that the synthetic instrument spread is the sum of spreads for each component, that means WHEAT and F-CATTLE.
