
AUD/USD has been trading in the 1.01-1.06 range for close to 10 months. A break either way has to come eventually. Here we look at a few factors that could swing the currency pair to the downside in the weeks to come.
AUD/USD fundamentals have been supported by buoyant asset markets and Australia’s G-10 high interest rate. In particular, the advent of Abenomics has enhanced the allure of buying the currency versus the Japanese yen, as AUD/JPY has surged as much as 30% in just a few months.
On the negative side for AUD -- interest rate support for the currency has been declining and would have plenty of room to compress further if the RBA turns more dovish (the highest interest rate also means the highest potential downside beta). Also, the key Australian mining industry has been very weak and China is showing signs of growth deceleration -- BHP Billiton stock is trading near last year’s lows as copper and iron ore prices have dropped sharply this year.
Here we look at a couple of charts that generally argue for an eventual downside break through the 2013 low of 1.0115. The main development that will be necessary across markets to get the AUD headed lower from here is a general rise in risk aversion to shake the complacency in the popularity of long-AUD carry trades and/or more concrete signs that the RBA is moving toward easing interest rates further. For AUD/SUD specifically, further support could come from the FOMC showing signs of slowing the pace of QE, though weak U.S. data of late suggests that this is less likely in the near future.
AUD/USD vs. Two-Year Rate Spreads
In the bigger picture, yield spreads versus the U.S. are nearing their lowest levels of the last year around 250 bps. AUD/USD isn’t 100% correlated with rate spread developments, though it tends to sway the action to some degree and all else being equal (which it isn't), AUD/USD would be trading lower here from an interest rate spread perspective. But in addition to outright yield, of course, we also have to consider the effects of the Fed’s multiple rounds of QE and the markets shifting expectations of whether the Fed will continue as is or reduce or even expand QE, which affects the USD side of the pair and is one of the reasons AUD/USD has managed to maintain itself in a higher range.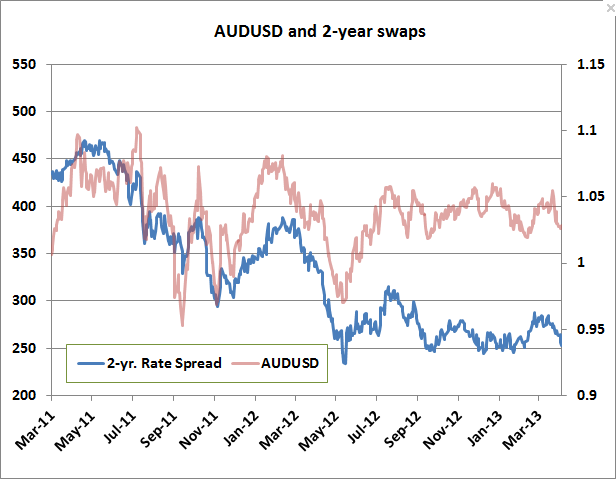 AUD/USD And Two-Year Spreads" width="616" height="479">
Zooming In…
If we zoom in locally on the above chart, we can see that the AUD/USD pair is more or less fairly priced relative to recent moves in the spreads.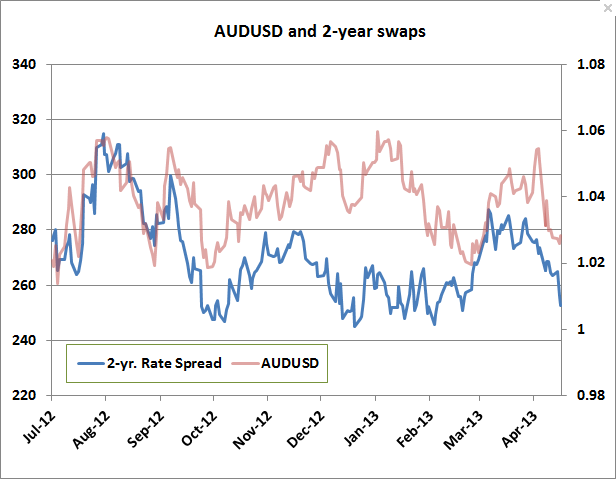 AUD/USD And Recent Spreads" width="616" height="479">
AUD/USD
Technically speaking, the 1.0115 to 1.0600+ channel dominates the landscape. There is trendline coming in a bit lower from here that could be of interest, but the really big trend-line comes in considerably lower (currently around 0.9850) if we connect the lows on the weekly chart. The first real break indication comes with a solid test through 1.0200 (near lowest recent close) and then through the actual low of 1.0115.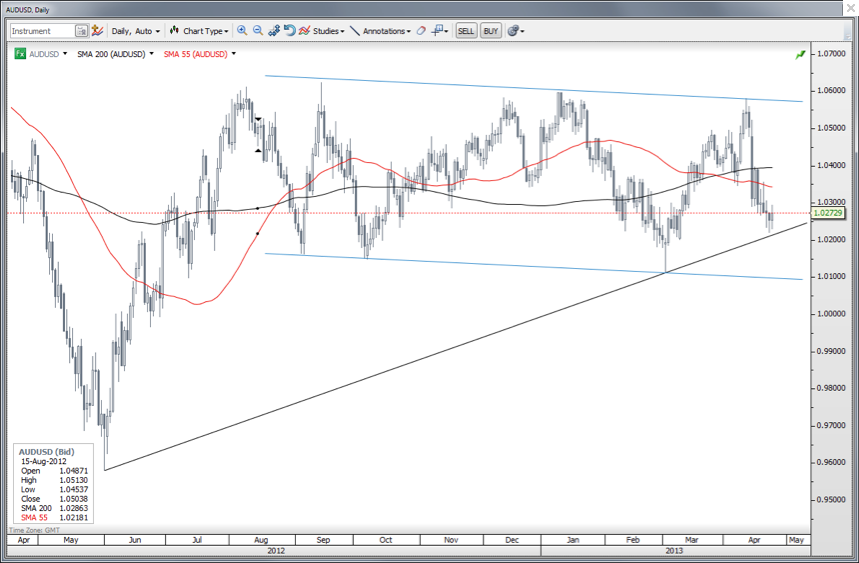 AUD/USD: Daily" width="859" height="563">
AUD vs. One-Month Volatility
We can see that implied options volatility often leads the action in spot, so we’ll likely need to see a rise in volatility tipping off a bigger break lower.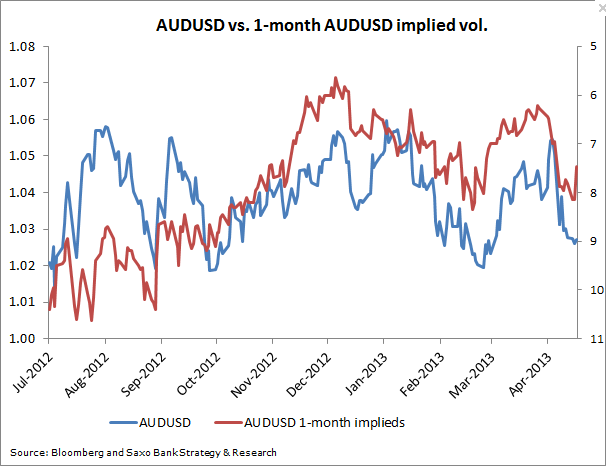
- English (UK)
- English (India)
- English (Canada)
- English (Australia)
- English (South Africa)
- English (Philippines)
- English (Nigeria)
- Deutsch
- Español (España)
- Español (México)
- Français
- Italiano
- Nederlands
- Português (Portugal)
- Polski
- Português (Brasil)
- Русский
- Türkçe
- العربية
- Ελληνικά
- Svenska
- Suomi
- עברית
- 日本語
- 한국어
- 简体中文
- 繁體中文
- Bahasa Indonesia
- Bahasa Melayu
- ไทย
- Tiếng Việt
- हिंदी
What’s Needed For The AUD/USD To Break Lower
Published 04/24/2013, 11:06 AM
Updated 03/19/2019, 04:00 AM
What’s Needed For The AUD/USD To Break Lower
3rd party Ad. Not an offer or recommendation by Investing.com. See disclosure here or
remove ads
.
Latest comments
Install Our App
Risk Disclosure: Trading in financial instruments and/or cryptocurrencies involves high risks including the risk of losing some, or all, of your investment amount, and may not be suitable for all investors. Prices of cryptocurrencies are extremely volatile and may be affected by external factors such as financial, regulatory or political events. Trading on margin increases the financial risks.
Before deciding to trade in financial instrument or cryptocurrencies you should be fully informed of the risks and costs associated with trading the financial markets, carefully consider your investment objectives, level of experience, and risk appetite, and seek professional advice where needed.
Fusion Media would like to remind you that the data contained in this website is not necessarily real-time nor accurate. The data and prices on the website are not necessarily provided by any market or exchange, but may be provided by market makers, and so prices may not be accurate and may differ from the actual price at any given market, meaning prices are indicative and not appropriate for trading purposes. Fusion Media and any provider of the data contained in this website will not accept liability for any loss or damage as a result of your trading, or your reliance on the information contained within this website.
It is prohibited to use, store, reproduce, display, modify, transmit or distribute the data contained in this website without the explicit prior written permission of Fusion Media and/or the data provider. All intellectual property rights are reserved by the providers and/or the exchange providing the data contained in this website.
Fusion Media may be compensated by the advertisers that appear on the website, based on your interaction with the advertisements or advertisers.
© 2007-2024 - Fusion Media Limited. All Rights Reserved.