Get 40% Off
🚨 Volatile Markets? Find Hidden Gems for Serious Outperformance
Find Stocks Now

What To Make Of Yesterday’s 4.4% S&P 500 Selloff

Published 04/02/2020, 01:04 AM
Updated 07/09/2023, 06:31 AM

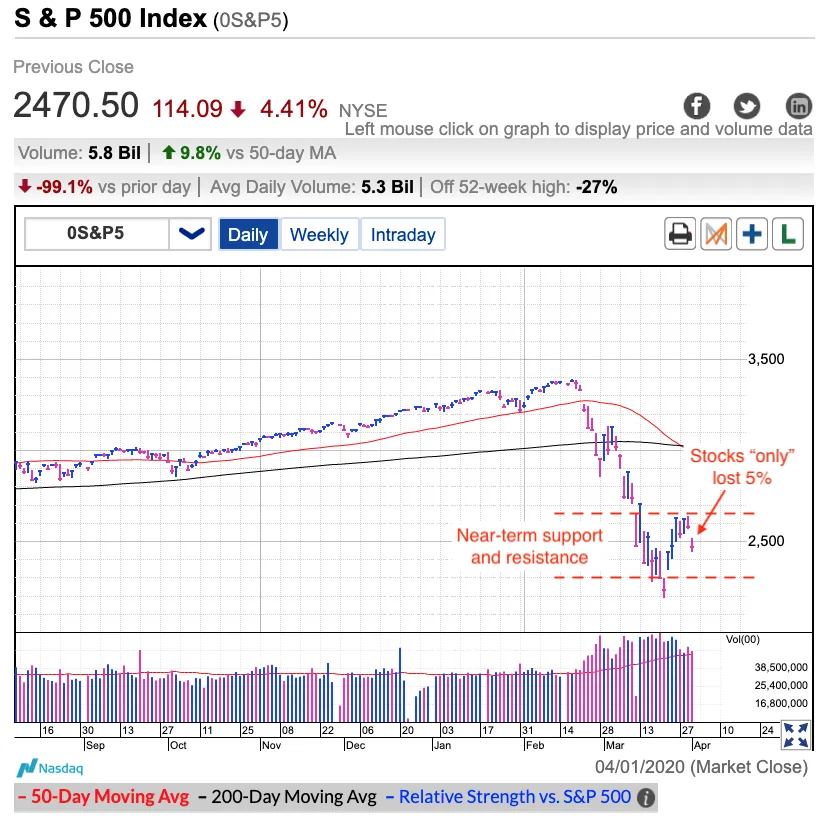
S&P 500 Daily Chart

The S&P 500 tumbled yesterday, nearly 5% in what would normally be classified as one of the worst days in stock market history. Now, however, it seemed like just another routine midweek dip. As callous as it sounds, 5% crashes don’t feel all that dramatic after experiencing -7%, -10%, and -12% plunges over the last few weeks. It’s almost gotten to the point where we could find ourselves saying, stocks “only” fell 5% .

The financial press claims yesterday’s selloff was in response to Trump’s new estimates of 100,000 to 240,000 American deaths from COVID-19. While that excuse sounds plausible enough to satisfy newspaper editors, the simple truth is yesterday was little more than a natural snap-back from last week’s towering 20% rebound. These 100k and 200k estimates have been floating around for days and are actually far less draconian than the 2 million fatalities that were initially projected.

Trump’s update didn’t surprise anyone who is paying attention and it sure didn’t catch the market off guard. The truth is yesterday’s move was nothing more than the natural ebb and flow of supply and demand. But rather than take place over 1%, 2%, or 3% increments, we are seeing 5%, 10%, and even 20% swings. This is routine stuff, just super-sized.

As for what comes next, expect more of the same. Last week’s towering rebound consumed a truckload of demand and now it is time for the sellers to take control. Unless we see these social-distancing efforts have a dramatic impact on infection rates over the next few days, expect the market to slip back to the lows. Whether we bounce above, at, or under the prior lows has yet to be seen, but we should expect more down than up over the next handful of trading sessions.

3rd party Ad. Not an offer or recommendation by Investing.com. See disclosure here or remove ads .

That said, this is still an incredibly volatile}} market and that means big moves in BOTH directions. Just because we will retest the prior lows at some point doesn’t mean it will be a straight line getting there. Expect volatility to remain off the charts. As such, the best trading plan includes taking profits early and often. Hold a few hours too long and today’s profits turn into tomorrow’s losses.

Latest comments

Agreed, and last paragraph is the way to act indeed.
Well written I will say this though this is worse than any of history crashes in the market. So in this rare instance I think it has to reprice itself much lower. 120 a share times 15 X equals 1800 and that’s if we do 120 a share. That’s why am saying it probably most likely be close to a straight line down. Bigdown days. Followed by fibonacci trading. But this market is not priced correctly and it’s always forwardly thinking the markets. So they’re way ahead so they have the pricing all of this destruction which is probably 1500 to 1800 on the S@P 500 in my opinion. first test 2030. Which I believe will go lower. My major point being that it will be fast and furious. so it’s still we are up in the upper 2500 range. Passive investing is dead. You need to be OUT OFF ALL ETF”S. 40 to 50% of those companies may not be in the stock market. That’s the reality. So it needs the price that in which is far from where we are now. Buy protection. Be smart
Agree, well said
Risk Disclosure: Trading in financial instruments and/or cryptocurrencies involves high risks including the risk of losing some, or all, of your investment amount, and may not be suitable for all investors. Prices of cryptocurrencies are extremely volatile and may be affected by external factors such as financial, regulatory or political events. Trading on margin increases the financial risks.
Before deciding to trade in financial instrument or cryptocurrencies you should be fully informed of the risks and costs associated with trading the financial markets, carefully consider your investment objectives, level of experience, and risk appetite, and seek professional advice where needed.
Fusion Media would like to remind you that the data contained in this website is not necessarily real-time nor accurate. The data and prices on the website are not necessarily provided by any market or exchange, but may be provided by market makers, and so prices may not be accurate and may differ from the actual price at any given market, meaning prices are indicative and not appropriate for trading purposes. Fusion Media and any provider of the data contained in this website will not accept liability for any loss or damage as a result of your trading, or your reliance on the information contained within this website.
It is prohibited to use, store, reproduce, display, modify, transmit or distribute the data contained in this website without the explicit prior written permission of Fusion Media and/or the data provider. All intellectual property rights are reserved by the providers and/or the exchange providing the data contained in this website.
Fusion Media may be compensated by the advertisers that appear on the website, based on your interaction with the advertisements or advertisers.
© 2007-2024 - Fusion Media Limited. All Rights Reserved.