Some industries are cyclical in nature. And there is not a darned thing you – or they – can do about it. Within those industries there are individual companies that are “leaders”, i.e., well run companies that tend to out earn other companies in that given industry and whose stock tends to outperform other companies in that industry.
Unfortunately for them, even they cannot avoid the cyclical nature of the business they are in. Take Halliburton Company (NYSE:HAL) for example. Halliburton is one of the world’s largest providers of products and services to the energy industry. And they do a good job of it. Which is nice. It does not however, release them from the binds of being a leader in a cyclical industry.
A Turning Point at Hand?
A quick glance at Figure 1 clearly illustrates the boom/bust nature of the performance of HAL stock.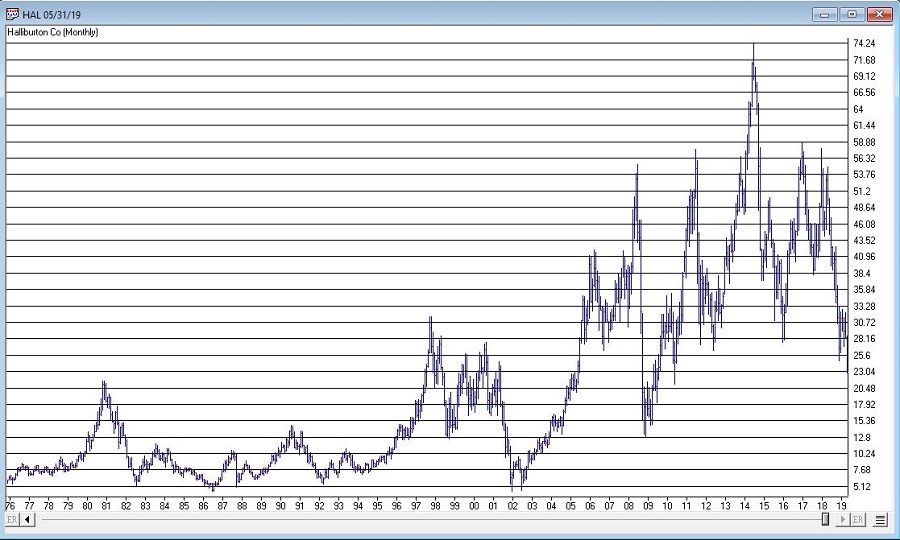
Figure 1 – Halliburton (HAL) (Courtesy AIQ TradingExpert)
Which raises an interesting question: is there a way to time any of these massive swings? Well here is where things get a little murky. If you are talking about “picking timing tops and bottoms with uncanny accuracy”, well, while there are plenty of ads out there claiming to be able to do just that, in reality that is not really “a thing”. Still, there may be a way to highlight a point in time where:
*Things are really over done to the downside, and
*For a person who is not going to get crazy and “bet the ranch”, and who understands how a stop-loss order works and is willing to use one…
..there is at least one interesting possibility.
It’s involves a little-known indicator that is based on a more well-known another indicator that was developed by legendary trader Larry Williams roughly 15 or more years ago. William’s indicator is referred to as “VixFix” and attempts to replicate a VIX-like indicator for any market. The formula is pretty simple, as follows (the code is from AIQ Expert Design Studio):
*hivalclose is hival([close],22).
*vixfix is (((hivalclose-[low])/hivalclose)*100)+50.
In English, it is the highest close in the last 22-periods minus the current period low, which is then divided by the highest close in the last 22-periods. The result then gets multiplied by 100 and 50 is added.
Figure 2 displays a monthly chart of HAL with William’s VixFix in the lower clip. In a nutshell, when price declines VixFix rises and vice versa.
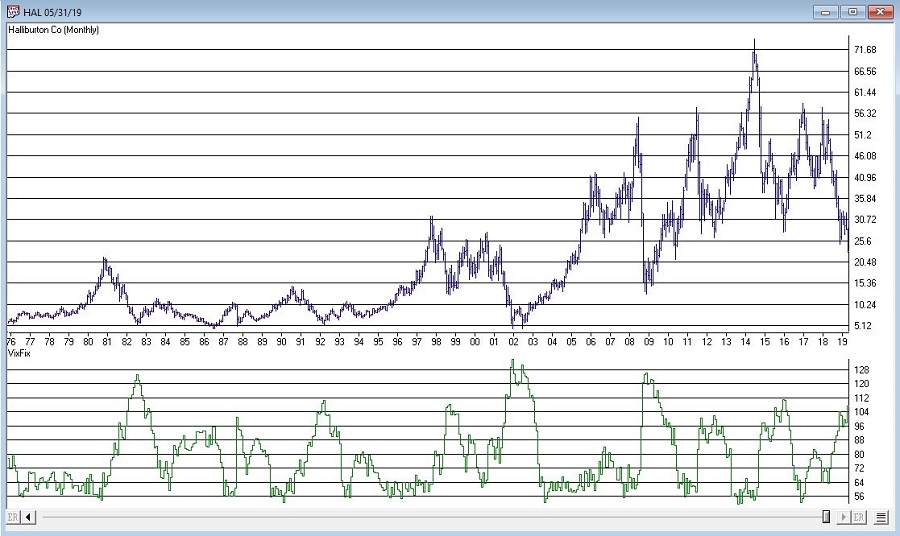
Figure 2 – HAL Monthly with William’s VixFix (Courtesy AIQ TradingExpert)
Now let’s go one more step as follows by creating an exponentially smoothed version as follows (the code is from AIQ Expert Design Studio):
*hivalclose is hival([close],22).
*vixfix is (((hivalclose-[low])/hivalclose)*100)+50. <<
*vixfixaverage is Expavg(vixfix,3). <<
*Vixfixaverageave is Expavg(vixfixaverage,7). <<
I refer to this as Vixfixaverageave (Note to myself: get a better name) because it essentially takes an average of an average. In English (OK, sort of), first Vixfix is calculated, then a 3-period exponential average of Vixfix is calculated (vixfixaverage) and then a 7-period exponential average of vixfixaverage is calculated to arrive at Vixfixaverageave (got that?)
Anyway, this indicator appears on the monthly chart for HAL that appears in Figure 3.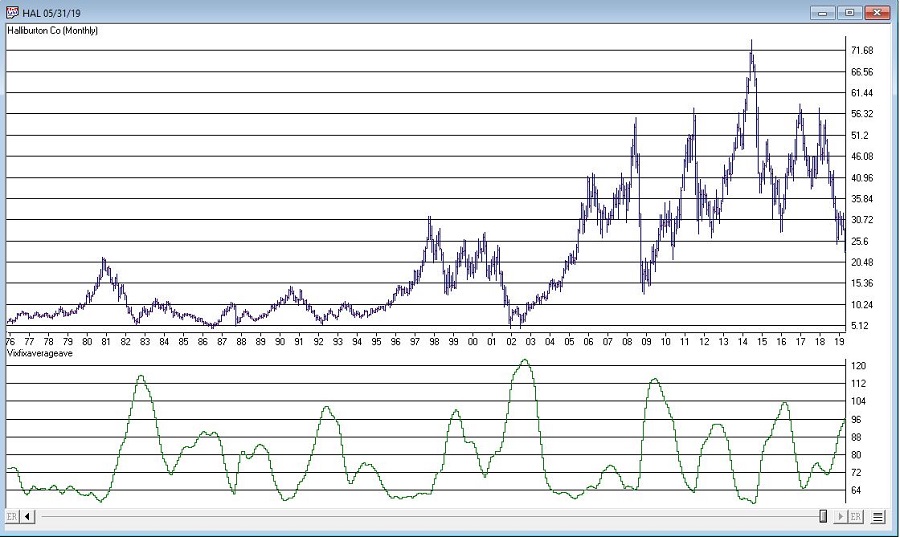
Figure 3 – HAL with Vixaverageave (Courtesy AIQ TradingExpert)
So here is the idea:
*When Vixfixaverageave for HAL exceeds 96 it is time to start looking for a buying opportunity.
OK, that last sentence is not nearly as satisfying as one that reads “the instant the indicator reaches 96 it is an automatic buy signal and you can’t lose”. But it is more accurate. Previous instances of a 96+ reading for Vixfixaverageave for HAL appear in Figure 4.
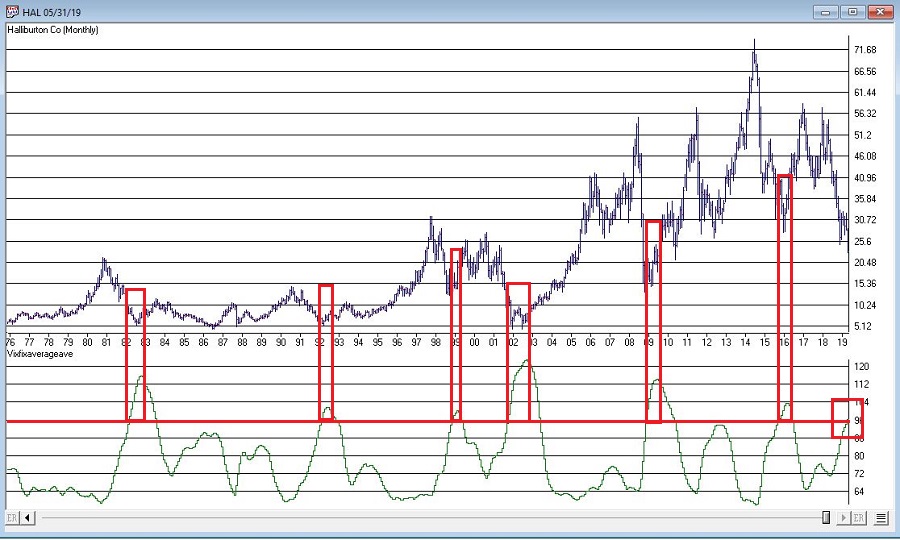
Figure 4 – HAL with previous “buy zone” readings from Vixfixaverageave (Courtesy AIQ TradingExpert)
Note that in previous instances, the actual bottom in price action occurred somewhere between the time the indicator first broke above 96 and the time the indicator topped out. So, to reiterate, Vixfixaverageave is NOT a “precision timing tool”, per se. But it may be useful in highlighting extremes.
This is potentially relevant because with one week left in May, the monthly Vixfixaverageave value is presently above 96. This is NOT a “call to action”. If price rallies in the next week Vixfixaverageave may still drop back below 96 by month-end. Likewise, even if it is above 96 at the end of May – as discussed above and as highlighted in Figure 4, when the actual bottom might occur is impossible to know.
Let me be clear: this article is NOT purporting to say that now is the time to buy HAL. Figure 5 displays the largest gain, the largest drawdown and the 12-month gain or loss following months when Vixfixaverageave for HAL first topped 96. As you can see there is alot of variation and volatility. 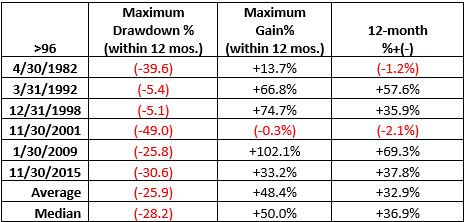
Figure 5 – Previous 1st reading above 96 for HAL Vixfixaverageave
So HAL may be months and/or many % points away from an actual bottom. But the main point is that the current action of Vixfixaverageave suggests that now is the time to start paying attention.
