Despite constant growth during the previous quarters, Apple (NASDAQ:AAPL) seems to be stuck between the future growth expectation and the currently prevailing fear of bearish market sentiments. Apple could be the best candidate for going short due to some bearish formations in the charts. Undoubtedly these bearish formations could negate the long-term growth story for a bit until the equity markets complete vicious bearish temperaments until October 2021.
Undoubtedly, some analysts find it an undervalued stock with hidden growth. But I find that Apple could see a steep fall during this season while the bears are roaring globally amid a sudden deadlock on global economic growth. I feel that Apple could see a price correction here and could see levels up to $103 and even $93.
Technical Formations showing weakness

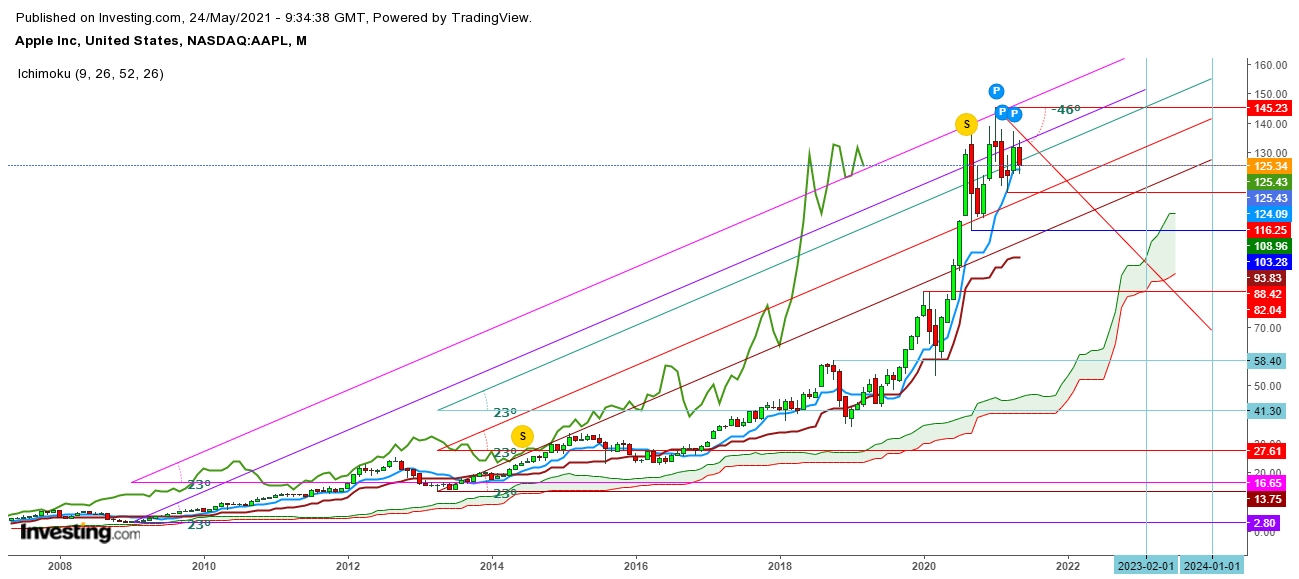
In the monthly chart, Apple feels it hard to cross the immediate resistance at $134 that has been tested during this month and could keep Apple under selling pressure for some more time. Currently, Apple has been just holding at 9 DMA in a monthly chart which seems to be weak support in current market conditions. If, Apple gets a fall from this level, the next support only at 26 DMA, currently at $93.
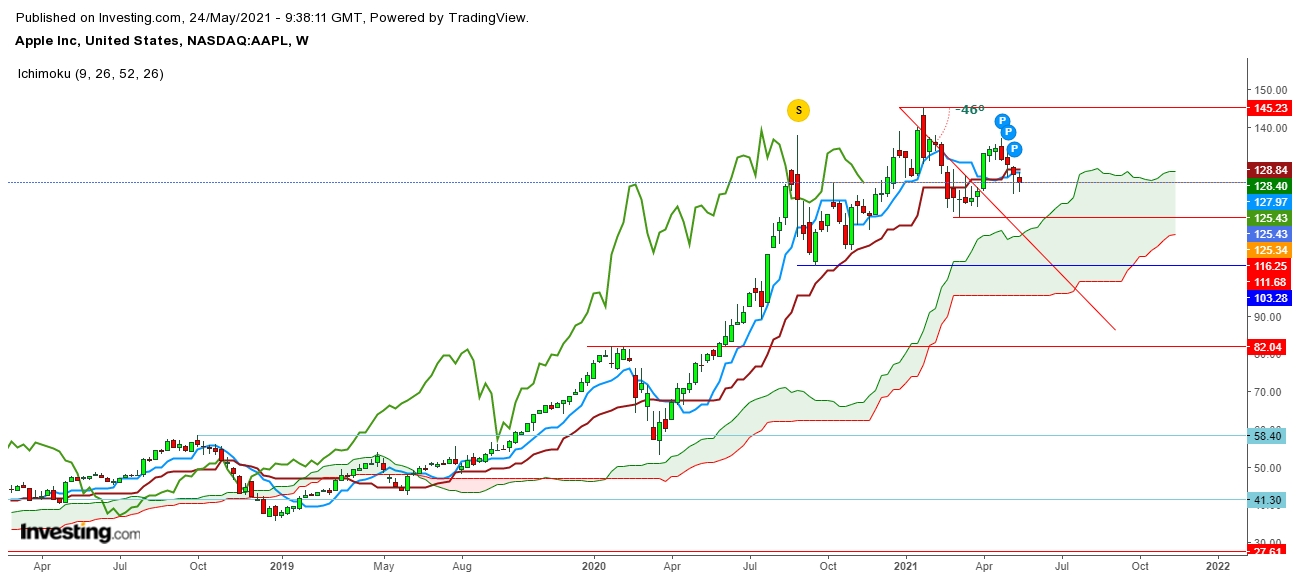
In the weekly chart, I find that Apple is on the verge of completing the ‘Head & Shoulder’ pattern. A weekly chart indicates that a sustainable move of Apple below $116 during this month could increase the velocity of this fall. Isaac Newton formulated the gravitational theory in 1665 or 1666 after watching an apple fall and asking why the apple fell straight rather than sideways or even upward. He was right. Currently, everyone thinks that the apple could touch the sky within a short time. Undoubtedly, anyone could not think about the gravitational force here which might cause Apple to fall straight down because there might be several reasons behind the gravitational force that the economic scenario could create.
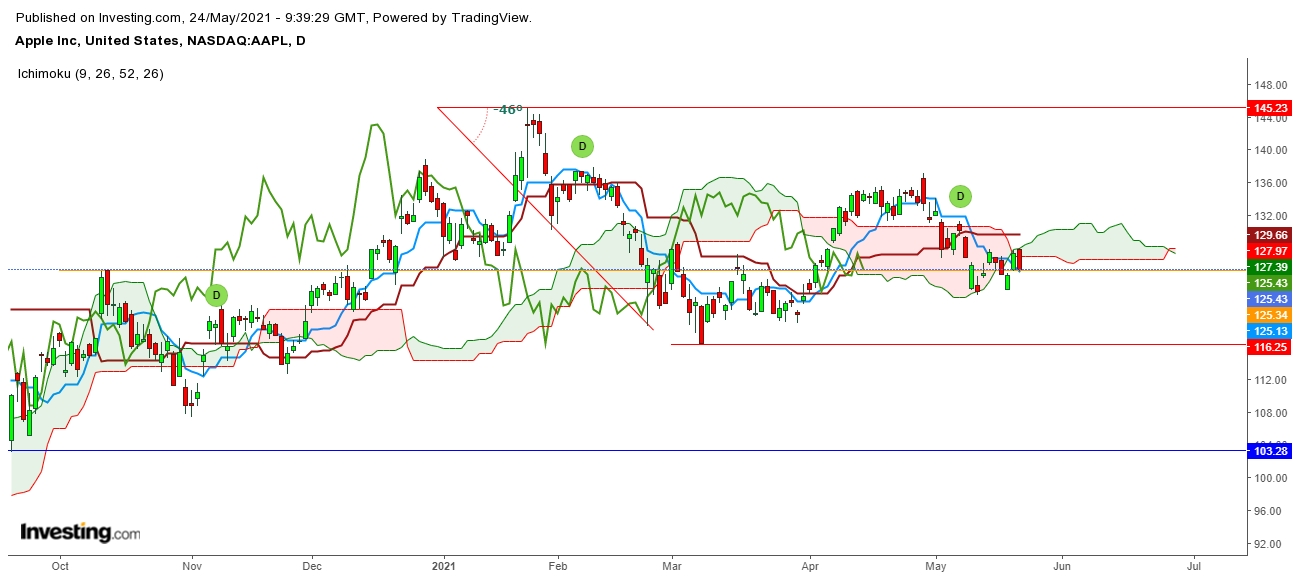
In the daily chart, Apple has formed a ‘Bearish Crossover’ which could apply immense thrust over Apple to see a downward move shortly. Undoubtedly, Apple could even test the short-term target at $116. Ichimoku Clouds indicates that Apple could find strong support at $82. My favorite level to go long from there in small bunches for a longer duration. I find that Apple could be the best long bet from $82 - $110.
Disclaimer
1. This content is for information and educational purposes only and should not be considered as investment advice or an investment recommendation. Past performance is not an indication of future results. All trading carries risk. Only risk capital be involved which you are prepared to lose.
2. Remember, YOU push the buy button and the sell button. Investors are always reminded that before making any investment, you should do your own proper due diligence on any name directly or indirectly mentioned in this article. Investors should also consider seeking advice from an investment and/or tax professional before making any investment decisions. Any material in this article should be considered general information, and not relied on as a formal investment recommendation.
