TrimTabs, a premier research provider to the institutional investment community, recently identified three troublesome aspects of current bullishness in stocks. First, the dollar value of U.S. stock buyback announcements has registered a five-year low. That’s problematic because corporate acquisition of stock shares has been one of the primary drivers of price gains during the current bull run.
Second, according to the chief executive officer at TrimTabs, David Santschi, the pace of insider buying dwindled to its slowest pace in five years. Corporate leaders do not always get it right. Then again, they often know more about their respective businesses than the public at large.
Perhaps the biggest area of concern? ETF inflows have been hitting extremes since the election. And according to Santschi, flows tend to be a strong contrary indicator. He wrote, “…when they [flows] become extreme, the buying frenzy doesn’t bode well for U.S. equities.”
Of course, none of the data have deterred the media from celebrating Dow 20,000’s imminent arrival. Indeed, euphoria has been rising directly alongside stock prices.
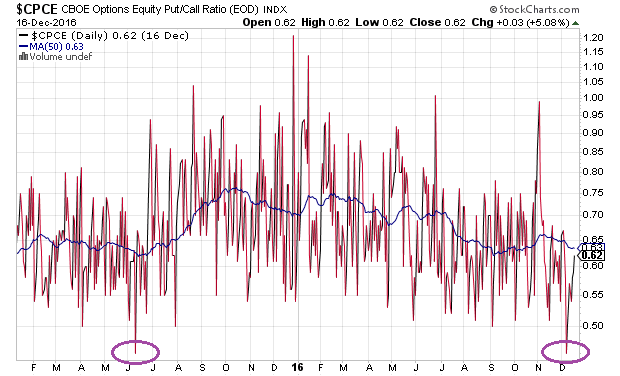
Published data on adviser bullishness shows advisers as more bullish right now than they were at the market peaks of 2000 and 2007 (4-week average). What about the put-call ratio? Bullish complacency just hit levels not seen since shortly before the 11% vertical drop in the August 2015 stock correction.
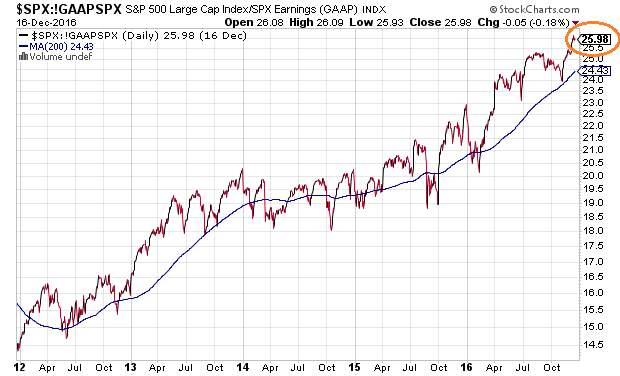
People are ignoring exorbitant valuation levels as well. P/E ratios on the S&P 500 of 26 will not matter until they suddenly matter.
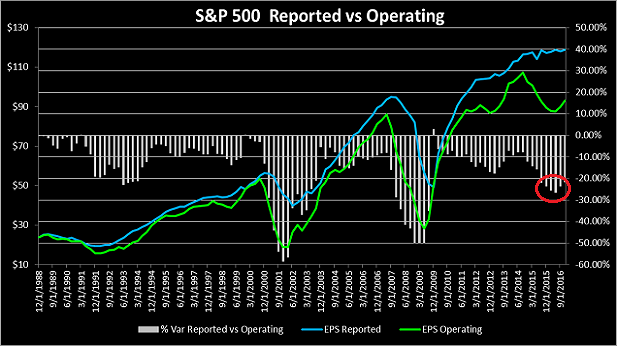
The same goes for earnings quality. Who cares that the spread between massaged operating earnings and reported earnings that conform to Generally Accepted Accounting Principles (GAAP) have surpassed 20% for six consecutive quarters?
At this juncture, many participants simply want to believe that hitting milestone markers like Dow 20,000 is a good thing. Few consider the greater likelihood that new highs nearly eight years into a bull market may be indicative of a cycle’s conclusion rather than a precursor to eight more years of equanimity.
Would restructuring corporate tax rates likely benefit S&P 500 profits going forward? Certainly. It would also lend a hand in the price-to-earnings picture. Some folks are banking on this corner-piece of the incoming administration’s agenda.
Unfortunately, higher borrowing costs may further inhibit stock buybacks, while the elevated U.S. dollar drags on S&P 500 profits earned abroad. The idea that tax cuts alone can overcome the headwinds of stagnant global growth as well as unfavorable currency trends and undesirable rate trends seems far-fetched.
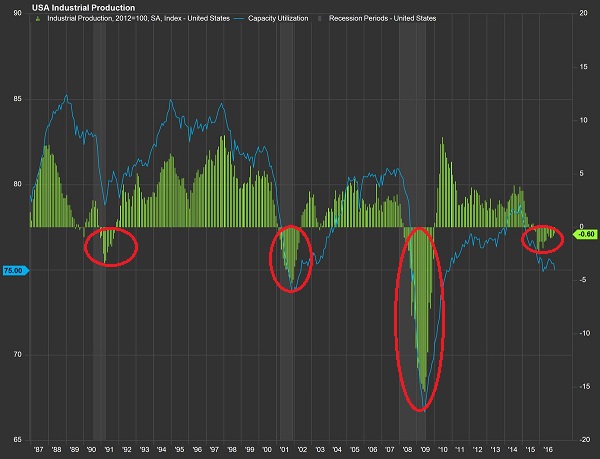
The Trump Administration may or may not be able to dramatically change the economic landscape for the better. Only time will tell if the president-elect’s team succeeds.
For those who assert that Trump’s economic approach will benefit stocks in the same way as “Reaganomics” did, they’d be wise to compare a few numbers. For example, as flawed as the U-2 unemployment measure is, the data point clocked in well above 10% when Reagan began. Today, while the labor force participation rate is quite similar to when Reagan arrived (62.7%), the perception of “full employment” currently exists with the U-2 measure at 4.6%.
Take household debt. The typical household in 2016 carries $132,529 in debt, including mortgages, and it is rising at a much faster pace than income. In August of 1982, the debt-to-income level was far more manageable and far more conducive for household consumption going forward. Even if we were to see personal income tax breaks in the year or years ahead, the money is likely to be spent more on reducing debt as opposed to the purchasing of discretionary products/services.
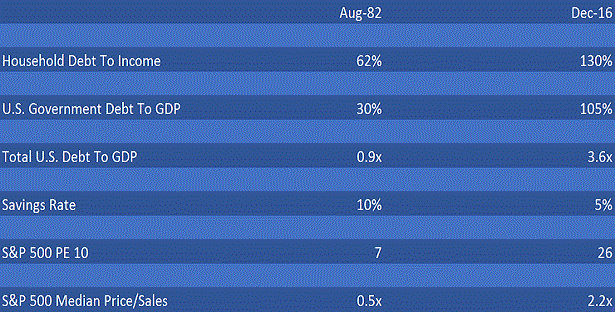
Most notably, in August of 1982, stock prices traded at a fraction of the levels that they are trading at right now. On revenue. On 10 years of earnings. On 1 year of profits. On forward “guestimates” of what corporations are likely to earn in the year ahead.
Granted, one might choose to argue that the president-elect will be successful in everything from infrastructure spending to trade negotiation to tax reform to regulation reduction. Yet we still won’t see 30% earnings growth over the next 12 months. And at current prices, that’s exactly what the market is pricing in; 30% earnings growth over the next 12 months.
It’s not that I believe one should be shorting U.S. equities. For the better part of two years, I have advocated the same 50/25/25 portfolio for moderate growth-and-income investors, with a preference for higher quality stock in funds like iShares Quality Factor (NYSE:QUAL) and iShares Russell 1000 Value (NYSE:IWD). That said, the allocation remains significantly underweight stocks in favor of cash equivalents.
Dow 20,000 may not foreshadow a devastating 50% collapse. Dow 20,000 may have little to do with what transpired in 2000 or 2008. By the same token, it is far more sensible to miss out on some of an aging bull’s upside than to participate in the bulk of an average bear’s 33% wealth destruction.
Disclosure: Gary Gordon, MS, CFP is the president of Pacific Park Financial, Inc., a Registered Investment Adviser with the SEC. Gary Gordon, Pacific Park Financial, Inc, and/or its clients June hold positions in the ETFs, mutual funds, and/or any investment asset mentioned above. The commentary does not constitute individualized investment advice. The opinions offered herein are not personalized recommendations to buy, sell or hold securities. At times, issuers of exchange-traded products compensate Pacific Park Financial, Inc. or its subsidiaries for advertising at the ETF Expert web site. ETF Expert content is created independently of any advertising relationships.
