At the beginning of March, US President Donald Trump imposed tariffs on steel and aluminum. This was after imposing tariffs on solar panels and washing machines back in January of this year. The last time there were tariffs imposed on steel imports was in 2002. What was the impact back in 2002 on the Dow Jones Industrial Average and the S&P 500? The Dot-com bubble had already burst. Was gold used as a safe-haven asset during this time? How did gold stocks respond during the turmoil, considering they were already unloved and unwanted?
THE DOW JONES INDUSTRIAL AVERAGE DURING THE 2002 STEEL TARIFFS
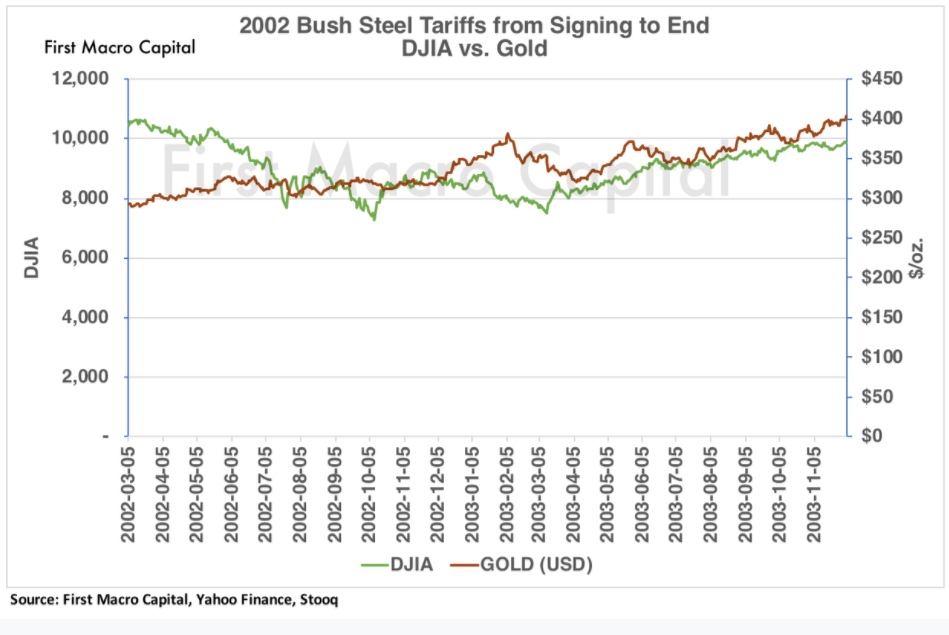
Between the last time steel tariffs were signed in March 2002 and the time they were revoked in December 2003, the Dow Jones went one direction after the signing. The index fell by more than 25%. The US dollar went down as well. The tariffs were one of the final catalysts after the Dot-com bubble, in sending the market further down. By the end of the tariffs, the Dow finished lower. No better off at the end of the day. Gold instead went in the opposite direction because of its safe-haven status. This was before the days of Bitcoin and cryptocurrencies. Gold also benefited from the decline of the US dollar and the tariffs, as it skyrocketed higher throughout the time the steel tariffs were in place. It ended over 35% higher during this period.

THE S&P 500 AND THE 2002 STEEL TARIFFS
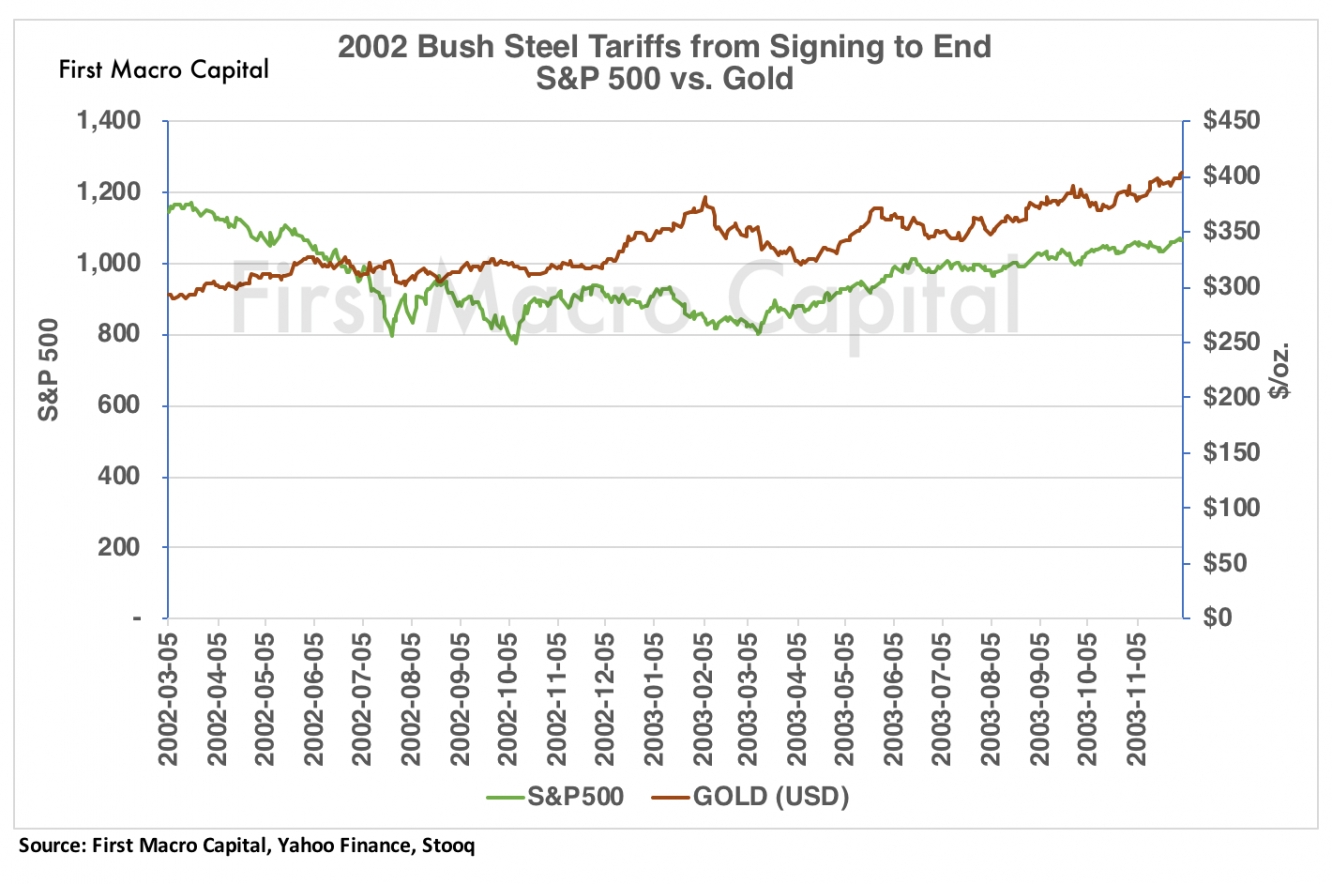
The S&P 500 didn’t fare much better than the Dow after the signing of the tariffs, in fact, its performance was even worse. The index went down by more than 30% once the tariffs were signed. By the time the tariffs had been lifted, the damage had been done, and the S&P 500 finished almost 10% lower. Not to be outdone, the tech sector took it the hardest, as the NASDAQ Composite fell by almost 40%. Surprisingly, the NASDAQ was the outperformer by the end of it, finishing in positive territory. The damage to the markets took about eight months to fully materialize, from the time of the signing, bottoming out in October 2002, for all three major US indices. Could the recent announcement of multiple tariffs be setting the stage for lower markets? Jeffrey Gundlach at DoubeLine Capital has stated the markets will finish lower for 2018. Will these new steel tariffs be the catalyst?
HOW DID THE GOLD BUGS INDEX RESPOND?
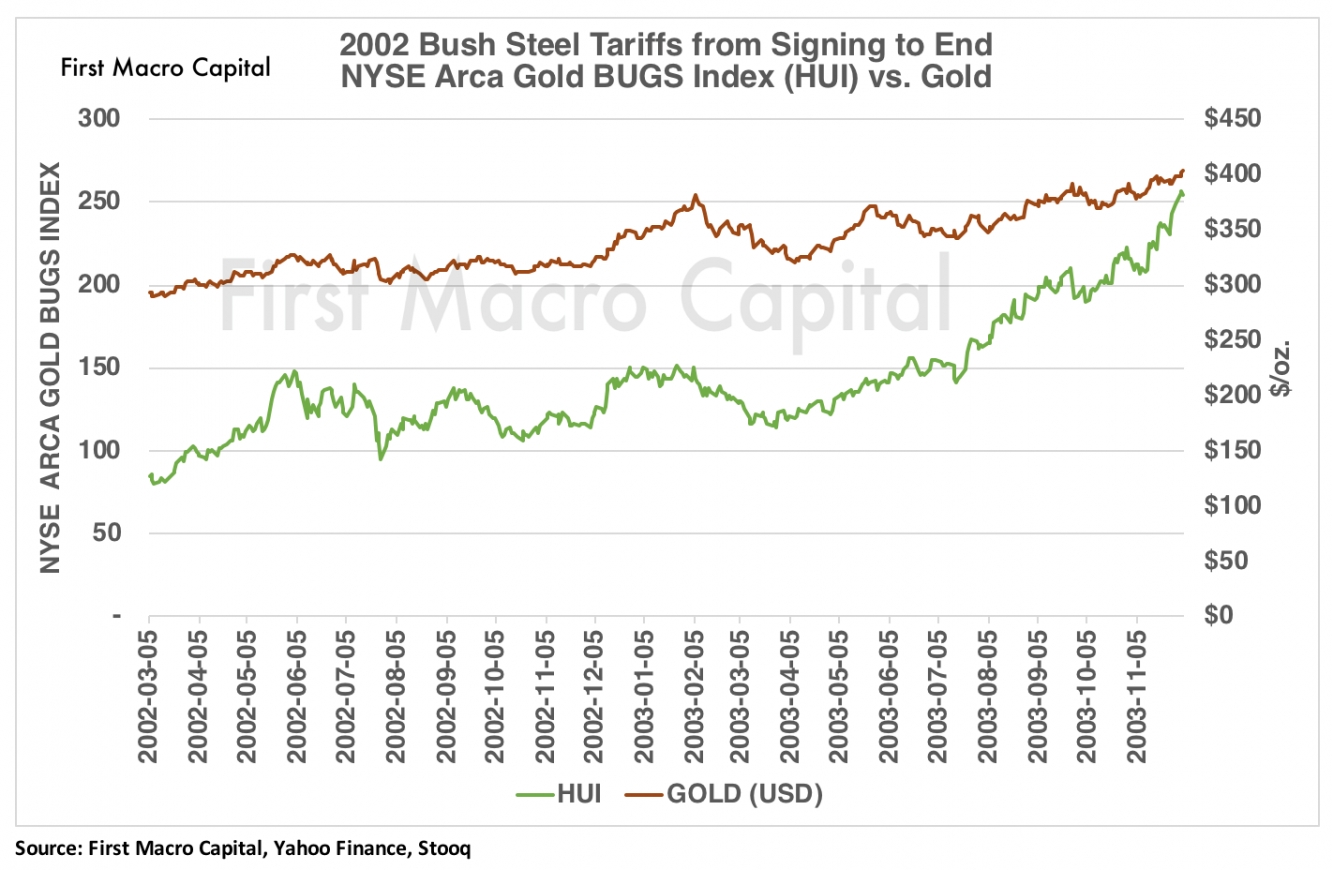
With gold up by more than 30% during the time the tariffs were imposed, and US equity markets ending with modest gains and losses. Would gold equities respond to higher gold prices? Did gold equities get pulled down with the broader market? When looking at the NYSE ARCA Gold BUGS Index, a basket of gold miners. The HUI initially accelerated higher by almost 75%. But it did experience headwinds, as the broader market went through the bottoming process in October 2002. By the end of September 2002, the HUI was up by just under 50%. Not bad, while the rest of the market was down by more than 20%. By the time the steel tariffs had been lifted, the Gold BUGS Index had appreciated by more than 200%.
HOW DID THE INDIVIDUAL GOLD STOCKS RESPOND?
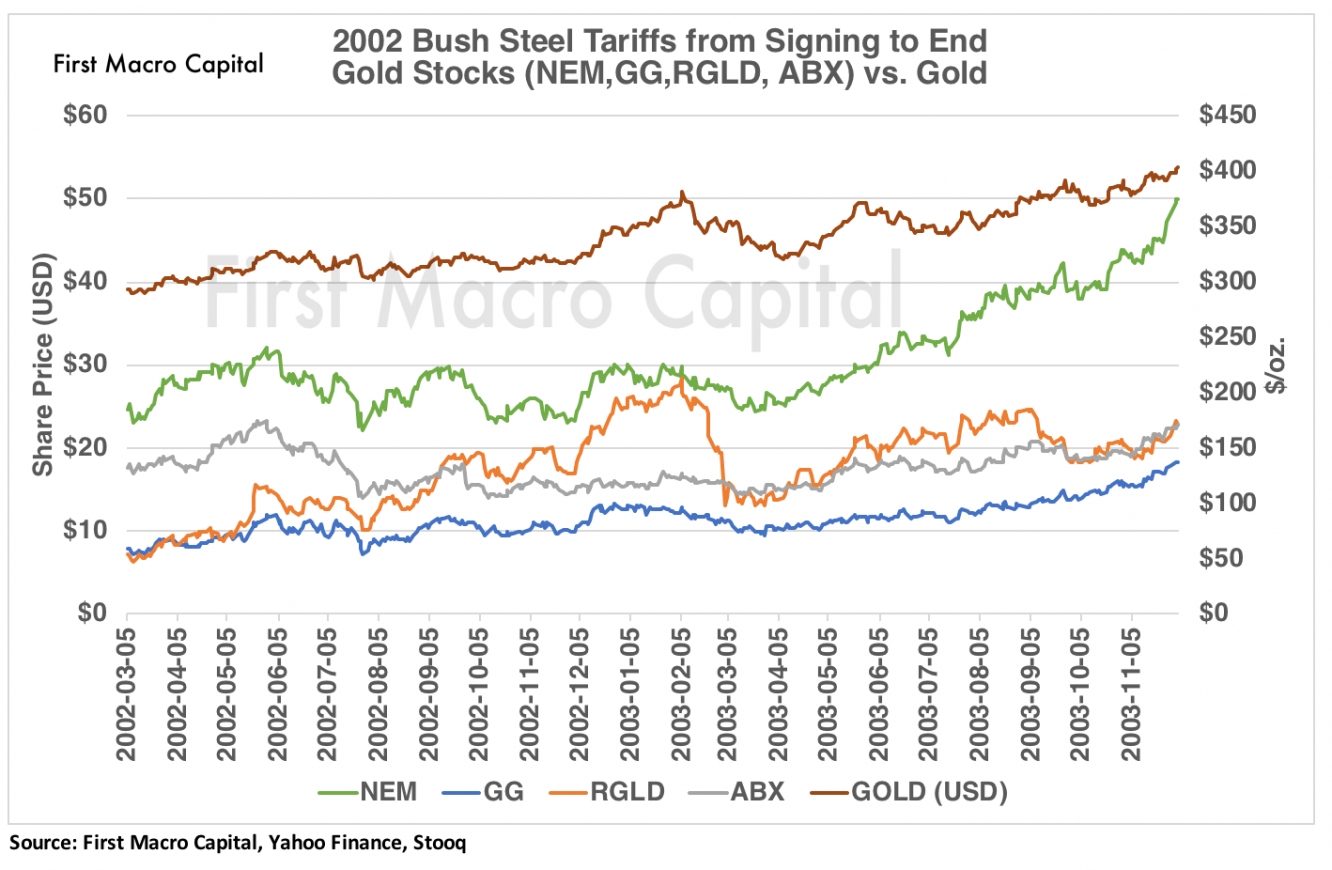
Not all the stocks were able to match the performance of the Gold BUGS Index. The major gold miners, Newmont Mining (NYSE:NEM) and Barrick Gold (NYSE:ABX), underperformed the index. Barrick Gold generated returns of approximately 30% before dividends, while Newmont Mining generated returns of just under the 110%. In comparison to the Gold Bugs Index which was over 200%.
The up and coming gold producer at the time, Goldcorp (NYSE:GG) and the royalty company Royal Gold (NASDAQ:RGLD), were able to outperform the majors of Barrick Gold and Newmont Mining. Goldcorp posted a return of about 140%, while Royal Gold generated a return of almost 230%. Will the smaller high growth gold stocks take the lead in 2018 over the majors, if the tariffs remain and history repeats itself? One would put the odds in favor of that occurring because of their embedded high production growth rates, starting at a smaller base. These smaller companies would assumingly exceed the growth rates of the majors, that have a challenge maintaining their current production levels. The law of large numbers becomes difficult for the larger producers, hindering their production growth. We could see further M&A in the gold sector if gold prices remain, and CEOs feel the pressure to act, pushing the junior prices higher in the process.
TARIFFS 2.0
After the signing of the steel tariffs to be imposed, gold is now up over $25 or almost 2%, while the S&P 500 and the Dow, have fallen by more than 5%. At one point, they were all down by more than 7%. So far, the current round of tariffs seems to be rhyming with the past. Will gold breakout of the range it has been over the past four years? The fall in the markets is happening at a much faster rate than during the 2002 tariffs, which is catching a lot of investors off guard, particularly after a strong start to 2018. Bitcoin has since fallen by more than half, with gold returning as its historical safe-haven asset as it was put aside, as being replaced by Bitcoin. It seems that as much as things change not much has really changed for now.
WILL THE FED CHANGE HISTORY?
The last time there were steel tariffs, interest rates were falling. Now, the scenario is flipped. The outlier could be what happens if the Fed continues to raise rates, as it has stated it plans to do. Will rising rates act as a counterbalance and bring more dollars back into the US, adding to the benefits of the tax cuts? Will this drive equity markets higher and put pressure on the bond market?
Although it is still early in this round of steel tariffs, history appears to be acting the same way it did during the last steel tariffs. A lower Dow, S&P 500, and NASDAQ, and higher gold. But interest rates were falling. The Fed's willingness to continue to raise interest rates appears to be one of the outliers from the 2002 tariffs. We will see how these tariffs unfold, and how countries respond, which we expect they will. Volatility only looks set to continue either way.
Paul Farrugia, BCom. Paul is the President & CEO of First Macro Capital. He helps his readers identify mining stocks that you can hold for the long-term.


