The put/call ratio didn't lie, and the anticipated S&P 500 upswing came on Friday – fireworks till the closing bell. On Thursday, the rising yields dynamic sent value stocks higher – and this time technology didn't stand in the way. What an understatement given the strong Friday sectoral showing, accompanied by the defensives swinging higher as well. And that's the characterization of the stock market rise – it's led by the defensive sectors with value stocks coming in a close second now.
Still last week, the market confirmed my take from Friday:
(…) While it's far from full steam ahead, it's a welcome sight that the reflation trade dynamic has returned, and that technology isn't standing in the way. I think we're on the doorstep of another upswing establishing itself, which would be apparent latest Monday. Credit markets support such a conclusion, and so does the premarket turn higher in commodities. Yes, I am referring also to yesterday's renewed uptick in inflation expectation.
Neither running out of control, nor declaring the inflation scare (as some might term it but not me, for I view the markets as transitioning to a higher inflation environment) as over, inflation isn't yet strong enough to break the bull run, where both stocks and commodities benefit. It isn't yet forcing the Fed's hand enough, but look for it to change – we got a slight preview in the recent emergency support withdrawal and taper entertainment talking points, however distant from today‘s situation.
Commodities have indeed turned higher on Friday, as seen in both copper and oil – and so did inflation expectations. While some central banks (hello, Canada) might be ahead in attempting to roll back the emergency support, the Fed isn't yet forced by the bond market to act – which I view as likely to change over the coming months.
With 10-year Treasury yields at 1.67%, last week's decline didn't reach far before turning higher. Remembering stock market woes the first breach of 1.50% caused, stocks have coped well with the subsequent run up. In the old days of retirees actually being able to live off interest rate income, a level of 4% would bring about trouble for the S&P 500. Now, the level is probably just above 2%. Yes, that's how far our financialized economy has progressed. I look for volatility to rise, and stocks to waver and likely enter a correction at such a bond market juncture. As always, I‘ll be keeping a close eye on the signs, emerging or not, as we approach that yield level.
What else to expect as the bond markets takes notice:
(…) Now, look for the fresh money avalanche, activist fiscal and moterary policy to hit the markets as a tidal wave. Modern monetary theorists‘ dream come true. Unlike during the Great Recession, the newly minted money isn't going to go towards repairing banks' balance sheets – it‘s going into the financial markets, lifting up asset prices, and over to the real economy. So far, it's only PPI that‘s showing signs of inflation in the pipeline – soon to be manifest according to the CPI methodology as well.
Any deflation scare in such an environment has a low prospect for success.
For deflation to succeed, a stock market crash followed by a depression has to come first. And as inflation is firing on just one cylinder now (asset price inflation not accompanied by labor market pressures). It isn't yet strong enough to derail the stock bull run. True inflation is a 2022-3 story, which is when we would be likely in a full blown financial repression and bond yields capped well above 2%, while the inflation rate could run at double that figure. Then, the Fed wouldn't be engaged in a twist operation, but in yield curve control, which the precious metals would love, for they love low nominal and negative real rates.
Gold might be already sensing that upcoming pressure on the Fed to act . Remember their run for so many months before the repo crisis of autumn 2019 broke out:
(…) After the upswing off the March 08 lows faltered, the bears had quite a few chances to ambush this week, yet made no progress. And the longer such inaction draws on, the more it is indicative of the opposite outcome.
Not only did gold miners outperformed the yellow metal on Friday, with their position relative to silver, the king of metals is sending a signal that it would be the one to take leadership in the approaching precious metals upswing.
Once higher rates challenge the stock market bull, the dollar would do well in a deflationary environment. But it would be the devaluation that would break it. It's my view that devaluation would not happen against other fiat currencies, but against gold (and by extension silver). With devaluation (it's still far away in the future), a true inflation would arrive and stay, which forms a more drastic scenario to the more orderly one I discussed earlier.
Another challenge for the stock market bull comes from taxes, as the current and upcoming infrastructure stimuli would result in higher tax rates next year, which would further hamper productive capital allocation as people and institutions would seek to negate their effect. Needless to say, gold, miners and real assets would do very well in such an environment.
Let‘s move right into the charts (all courtesy of www.stockcharts.com).
S&P 500 Outlook

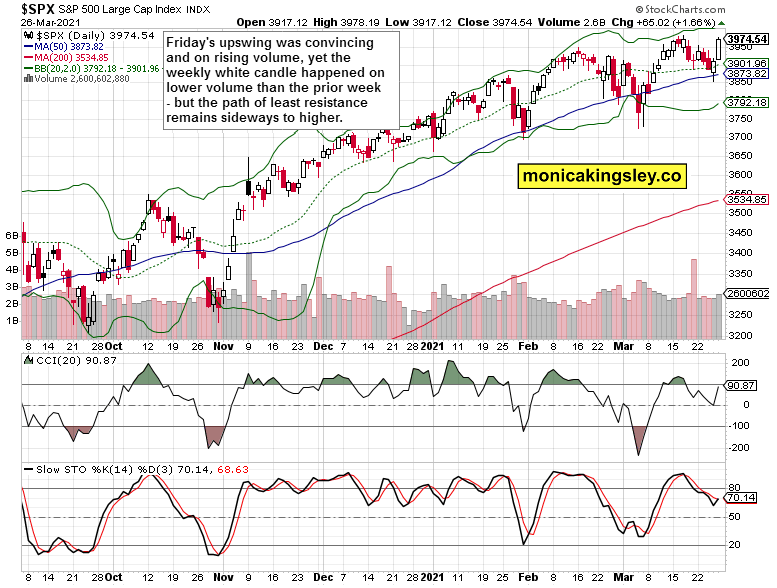
Strong S&P 500 upswing on Friday, on not-too-shabby volume. The key question is whether the bulls can keep the momentum on Monday, and ideally extend the gains at least a little. Signs are they would be able to achieve that.
Credit Markets

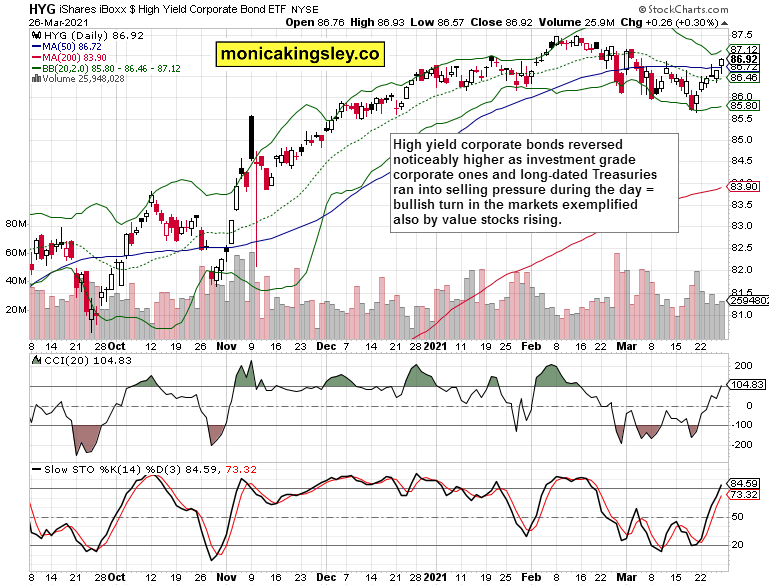
High-yield corporate bonds (iShares iBoxx $ High Yield Corporate Bond ETF (NYSE:HYG)) reached the mid-March highs, and need to confirm Friday's upswing – odds are they would continue higher on Monday as well, because the volume comparison is positive and daily indicators don't appear yet ready to turn down.
Inflation Expectations

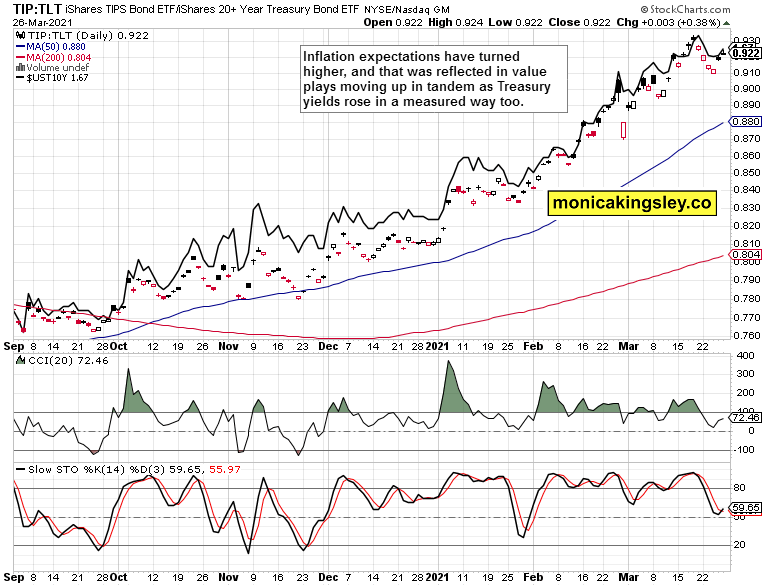
Inflation expectation as measured by Treasury inflation protected securities to long-dated Treasuries (TIP:TLT) ratio, keep making higher highs and higher lows – the market is recalibrating towards a higher inflation environment, but not yet running ahead of the Fed as the 10-year Treasury yield (black line) shows. It‘s so far still orderly.
Small Caps And Emerging Markets

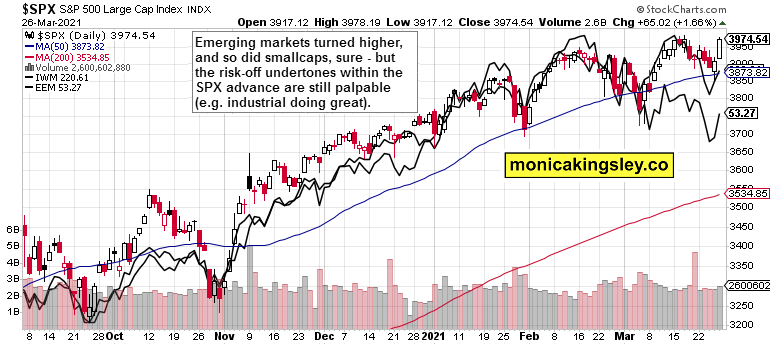
The (iShares Russell 2000 ETF (NYSE:IWM) (upper black line) is underperforming the S&P 500, and so are the emerging markets (iShares MSCI Emerging Markets ETF (NYSE:EEM). Both are signals of the defensive nature of the stock market upswing. The animal spirits aren't there to the full extent (don't be fooled by the strong VTV showing), but have been making a return since Thursday.
Summary
The odds of an S&P 500 upswing were confirmed by Friday's upswing, in line with the put/call ratio indications. Credit markets concur, and while the sectoral constellation isn't totally bullish, it can still carry the index to new highs.
