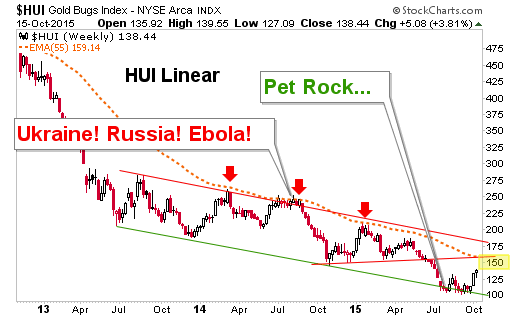
The gold sector’s fundamentals, both sector-specific and macro, are improving and this was not the case during the last exciting upturn in the sector circa summer 2014.
Back then everything from Russia’s move into Ukraine to the Ebola scare were imagined to be sound drivers of the gold price. This stuff proved, as expected, to be wrong when the whole complex made new lows in November of 2014 (prior to this year’s ultimate lows).
What is driving gold and the gold sector this year? The things that we have been saying for years now would be needed.
- Gold rising vs. commodities: Indicates a counter-cyclical global economic atmosphere (engaged)
- Gold rising vs. stock markets: Indicates an environment in which mainstream investors would be motivated to consider the sector (constructive, not yet engaged)
- Gold rising vs. global currencies: A self-explanatory indicator of waning confidence (constructive+)
- Declining junk/quality bond spreads: Indicates waning confidence in the financial system and those who have propped it up (engaged)
- Economic contraction as presented in mainstream economic data releases (constructive, not yet engaged)
- Treasury yield spreads rise: Indicates risk aversion to systemic stress, whether inflationary or deflationary and waning confidence (10yr..-2yr. inconclusive as of yet, 30yr.-5yr. engaging)
There are more details, but the above would paint a picture of a counter-cyclical environment, which is the investment environment for gold and would set quality miners up for a big rally or bull market. Here’s the Macrocosm (July 27) graphic again for a visual representation of the gold sector’s primary fundamental underpinnings.

Dial back to this past summer around the time the Macrocosm shtick was created by someone with apparently too much time on his hands (not the case, I assure you!). Back then (July 17) the Wall Street Journal called a bottom on gold exactly 1 week before it made its low at 1072.
This was not a bunch of lunatics fighting each other for the right to get on the soap box and rally the troops to buy gold and hide in their bunkers for fear of the Russian horde (that and the Ebola headlines were so contrarian bearish it was palpable). This was a classic bullish contrary indicator and most recently as HUI dropped to the long-term Head & Shoulders target of 100 (101 and change) we watched it scrape along the bottom of its downtrend channel for signs of a bounce, noting that the fundamentals were firming and aided, not hurt by the media this time.
Here is the linear scale chart NFTRH used to gauge this possibility last summer for subscribers, even as log scale charts were put forth on the internet showing a breakdown below the channel for the relatively new cottage industry in gold bearishness to consider. Not this time boyz.
As you can see, it was touch and go at the channel bottom for weeks and I am not going to pretend to have been a resolute gold stock bull during that process. Indeed, hear this clearly… gold stocks are in a bear market, technically speaking. They are technically in a bear market even if they are in a bull market because not even the first technical milestone has been accomplished; nor would or could it be at his juncture.
But again, it is different this time because sector and macro fundamentals are either in line or slowly creeping in the right direction. You probably don’t need me to tell you that there is going to be some turbulence ahead, whether HUI gets to what we are still calling its “bounce” target in the 150’s first or not. But the nature of the sector is much improved from a fundamental standpoint; sector and macro.
The gold sector is on a technical bounce that we have anticipated since mid-summer and managed since September. With sentiment getting over bullish and Commitments of Traders data putting a bulls’ eye on silver lately, the ingredients are in place for a negative reaction. When it comes, whether from the bounce target in the 150’s or somewhere lower, it will pay for players to have their fundamental ducks in a row, unlike in summer 2014.
Many people know me as a chart guy but I am here to tell you that it is the fundamental backdrop that will be for all the marbles. The charts right now, bounce aside, remain in bearish trends for gold stocks (aside from a few little gems bucking the trend), gold and silver. We are following these trends consistently in NFTRH, but just as consistently we are keeping tabs on sector and macro fundamentals, which would lead the technicals just as most of the fundamentals noted above did in Q4 2008, only it was in quick time… like 100x faster than today’s situation.
Bottom line
On the article’s main topic, the gold sector is bouncing and this time it has a fundamental right to do so. The sector is in a bear market but the elements are aligning to end the bear. It is time to know what to tune out and what to take in when managing the process. The negative reactions will come and only a clear view considering sector and macro fundamentals and technical analysis will define whether and from what levels those are buying opportunities.

