
Wells Fargo (WFC) stock price declined to $45 on market’s open yesterday, after the bank announced its Q4 earnings. The uptrend that followed is a great example of how to trade stocks during earnings season.
Once again, I am going to talk about support and resistance levels. Only this time, I’m going one timeframe at a time.
Wait, don’t we care of the actual earnings report? I don’t, other than the fact that I check which companies are announcing earnings, before I add a stock in my watch list for the particular day. If you are though, you can have a look at Motley’s Fool article on Wells Fargo earnings.
Wells Fargo Charts: Daily To 5 Minute
Here is the daily Wells Fargo stock chart. Note that I have omitted Tuesday’s candlestick, as I will describe my trading mentality before the market’s open.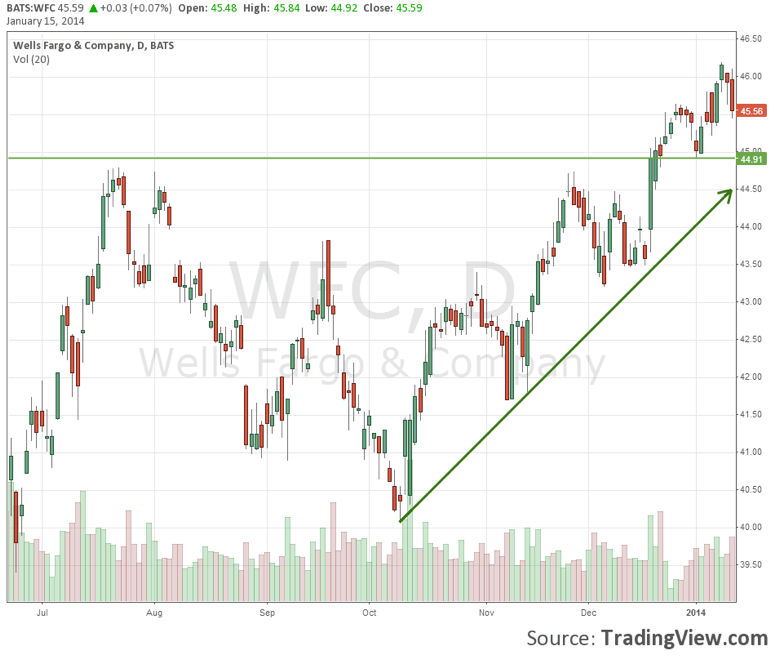
By looking at this chart, I immediately notice that:
- Wells Fargo stock is trending upwards. The stock price pulls back about 50% before it prints a new higher top during the past 4 months. I don’t normally draw such an obvious trendline, but I’m including it for illustration purposes here.
- The stock is trading higher than the significant resistance level at $44.75, which used to be the 6-month high till December. The breakout that occurred on December 18 sent Wells Fargo stock price to $45 during a day, when bulls controlled the market throughout the session. That explains the long green body of that specific day’s candlestick.
- WFC stock pulled back to $45. That level will probably provide support to future retracements.
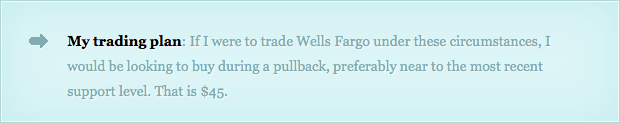
Now, let’s move down to the 15-min chart of Wells Fargo stock. In this chart though, I’m including the price action that took place after the earnings report.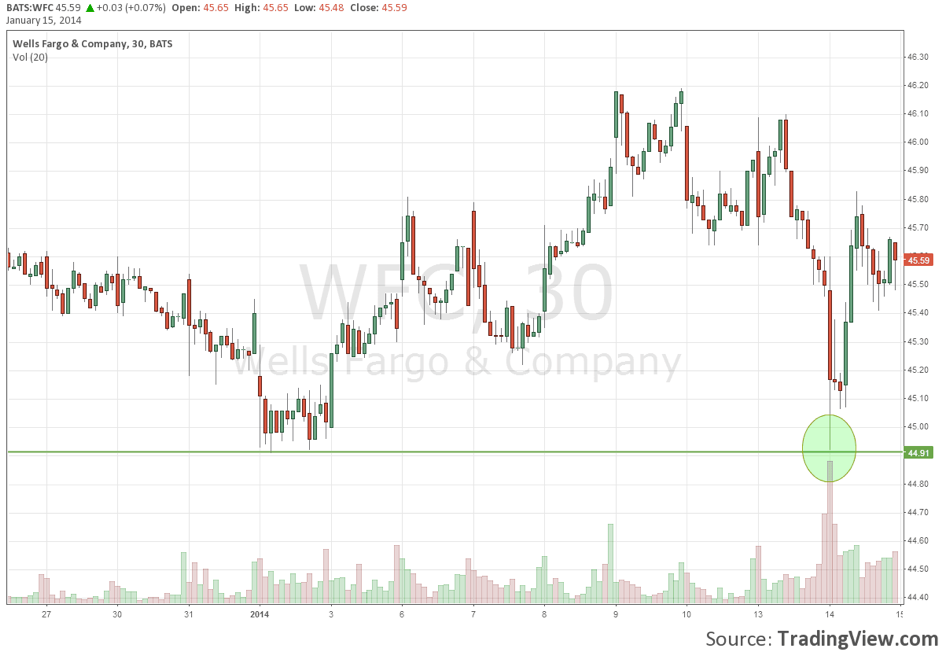
The green support line is the one I drew in the previous chart. The stock price pulled back to that level during the first half an hour of trading. Remember, it’s a pullback, given the confirmed uptrend that Wells Fargo stock is following. That is worth mentioning, because by looking at that shorter timeframe, one could assume that the stock is moving sideways.
As I noted, my trading strategy would be to buy near $45. One likely scenario would have been to submit a limit buy order at $45 (round number), when the market opened. Thus, my order would be executed in the first 30 minutes of trading. Moreover, wherever I would place my stop loss, it would never have been hit.
Yet, another strategy would be to wait for confirmation in even shorter timeframes. Let’s go down to the 5-min chart!
This is how Wells Fargo stock price moved along during the day that the bank’s earnings were announced. It opened at $45.60, declined down to $45 and went back up to day’s high at $45.83. Did the confirmation I required, happen?
You bet it happened! That candlestick pattern that I have circled on the chart may very well be considered a bullish pattern. And when such a pattern is printed at a key support level, I am willing to initiate a trade.
That’s great, but where do I sell now?
Setting Profit Targets
I need to go up one timeframe and take another look at the 15-min chart. If you do that, you’ll notice a support level that failed on December 13.
Do that now, I’ll wait.Yes, I’m referring to the support level at $45.60 that failed during the pullback. That support level will most probably convert into a resistance one. So, that’s a good point to set my first profit target, locking in my first profits.
Was that price target hit? Yes, it did! Should I have gone long on Wells Fargo stock on its earnings day, I would have made $0.50 per share in 3 hours.
Simultaneously I would have moved my stop loss to my entry point ($45.10). I would no longer risk any money on this trade.
That's what I call 'day trading'.
But that’s not the end of the story. As I would have closed 70% of my positions right there, I need to set my second profit target where I would sell 20% of my Wells Fargo shares. I could afford letting the remaining 10% run, riding the multi-year uptrend of the banking stock. I would then use a trailing stop.
Can you guess where I would set my second profit target?
Exactly, I would now go one more timeframe up and check the daily chart, just as I started this analysis! Second target profit set at the new 6-month high; that’s at $46.20. And if that is hit, that would be $1.10 per share in my pockets.
When a company announces earnings, I am expecting increased volatility. That volatility may create an opportunity to trade, such as in Wells Fargo’s case.
Did I trade this stock? No, I do not have any Wells Fargo shares. But if I did, that is how I would trade. How would you? Let me know in the comments below.