Get 40% Off
🤯 Perficient is up a mind-blowing 53%. Our ProPicks AI saw the buying opportunity in March.Read full update

Welcome To The Zombie-Land Of Investing – Part I

Published 11/11/2019, 12:29 AM
Updated 07/09/2023, 06:31 AM

This current market environment is very reminiscent of the 2006-08 market environment where price rotated into weakness on technicals and continued to establish new all-time price highs in the process – creating what we are calling a “zombie-land melt-up”. This very dangerous price action is indicative of money chasing a falling trend. Where technicals and fundamentals are suggesting that price is actually weakening quite substantial, yet the process of price exploration is continually biased towards the upside as investors continue to pile onto the back of the beast expecting a further melt-up.

Let’s take a look at what happened to the ES and Gold in 2006 and 2007.
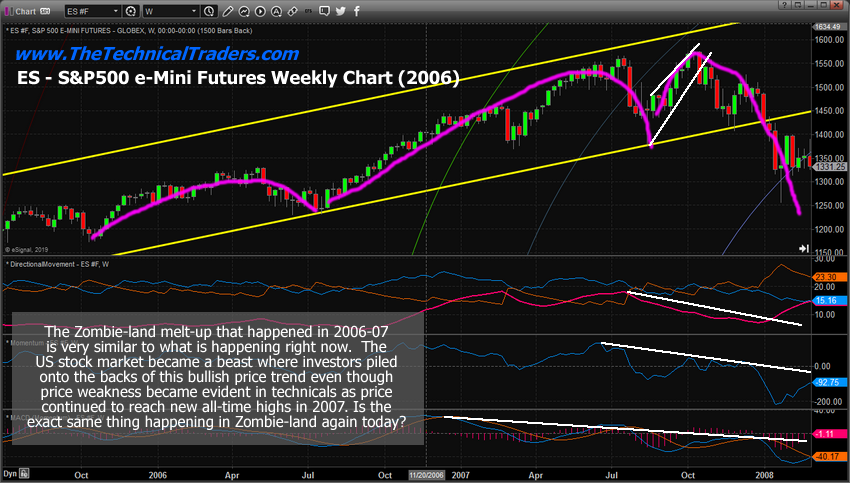
SP500 Weekly Index Chart In 2006-2007

S&P 500 Weekly Index Chart in 2006-2007

First, we’ll start with the ES (S&P 500 E-mini futures contract). Pay attention to the MAGENTA arcs we’ve drawn on this chart that highlight the continued new highs reached throughout 2006 and 2007. Pay attention to the price rotation and volatility that started to happen near the absolute peak in July and October 2007 – just before the massive price collapse began. Notice how the technical indicators had been suggesting that price was weakening quite extensively since the beginning of 2007 and more aggressively after July 2007. Pay very close attention to the last peak on this chart and how a very deep price correction setup a new price high in a very tight FLAG formation just before the breakdown event.

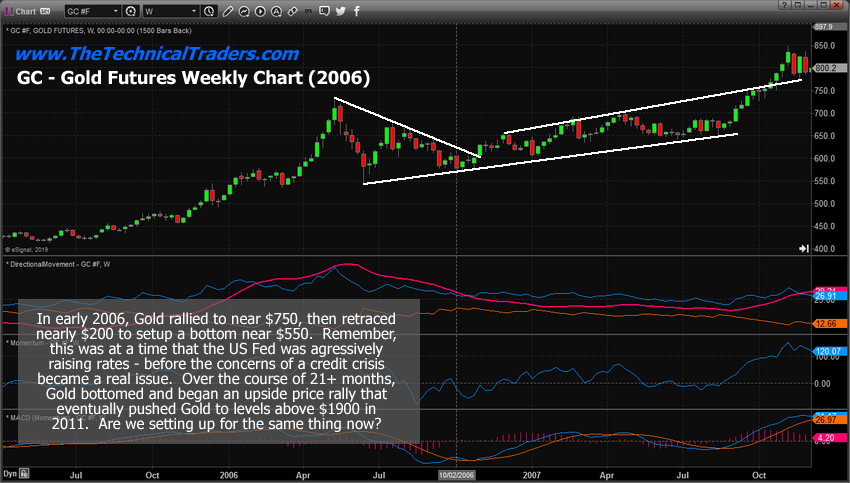
Price Of Gold Weekly Chart in 2006-2007

This Gold chart from the same time period highlights how Gold anticipated the market weakness by rallying up to a level near $750 in May 2016 – then retraced nearly $200 before forming a lengthy price bottom/base. Gold, acting as a safe-haven for investors, rallied almost 94% in the 24 months prior to this peak in 2006. It rallied another 256% (at the ultimate peak) from the low point established in June 2006. The process of this rally was an extended base/bottom in Gold between the base/bottom in 2006 and the renewed uptrend that started just before the end of 2007 (just before the markets started crashing).
3rd party Ad. Not an offer or recommendation by Investing.com. See disclosure here or remove ads .
Price Of Gold Weekly Chart In 2006-2007
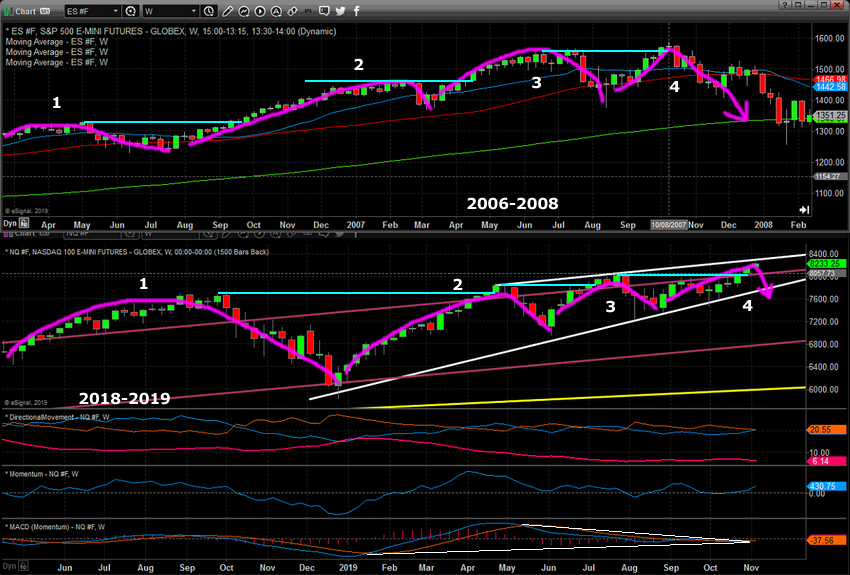
Compare SP500 Index 2006-07 To 2018-19

Compare S&P 500 Index 2006-07 to 2018-19

We believe the current uptrend in the US stock market is acting in a very similar price formation to what we’ve highlighted in the 2006-07 market “zombie-land melt-up”. We believe that investors are piling into the US stock market when price weakness is clearly being illustrated by the technical and fundamental data. We believe a capital shift has continued to pile money into the US stock market as foreign investors pile onto the backs of other investors seeking safety and security within a stronger US economy.

Concluding Thoughts:

We believe the current Zombie-land market is anticipating a price roll-over event (reversion) and that technical and fundamental data supports this analysis. We believe the credit/debt expansion of the past 8+ years has fueled a massive bubble that may result in a deep price correction if given the right circumstances and events. We believe this upside price move in the US markets, which are setting up near the exact same time-frame as the 2008 price collapse, maybe a very stern warning for traders and investors – BE PREPARED.

In Part II of this research post, we’ll highlight the similarities setting up in the current market “Zombie-land” and what happened in 2006~2008. The expansion of the credit market over the past 8+ years has been extensive throughout the globe. The biggest difference this time is that risk may come from foreign markets vs. from within the US.

Keep reading our research because our proprietary tools have been nailing all of these price targets and move many months in advance.

3rd party Ad. Not an offer or recommendation by Investing.com. See disclosure here or remove ads .

Latest comments

What do you mean “if given the right circumstances and events” IF I’ll be a rich man I would fire you now Since when base our decision on IF.
These are the same people who said that the market would peak on 19 August 2019 based on some fancy model. The fact is that no body knows nothing for sure about the long-term trends. Writing about future trends is just a way to make money for these highly paid, thick-skinned guys. Their guesses are as good as ours. In any case, a trader cannot trade based on expected long-term trends if he has limited capital. Those predictions can come true, but can you remain solvent till that time? Nowadays markets are even less predictable because they are even more detached from the fundamentals. It is all about how the smart money wants to interpret any event. Post-facto, reasons can be given and justifications can be made. These articles only weaken your will to make it on your own in the financial markets. They make you dependent because you want something to rely upon or someone to blame. These smart people are right 50% of the time, just as you and me. So why bother about these 'experts'?
Look closely at your charts... you're comparing 2018-2019 NQ chart to 2006-2008 S&P..... that's pretty sloppy for a 'well-researched' article.
Risk Disclosure: Trading in financial instruments and/or cryptocurrencies involves high risks including the risk of losing some, or all, of your investment amount, and may not be suitable for all investors. Prices of cryptocurrencies are extremely volatile and may be affected by external factors such as financial, regulatory or political events. Trading on margin increases the financial risks.
Before deciding to trade in financial instrument or cryptocurrencies you should be fully informed of the risks and costs associated with trading the financial markets, carefully consider your investment objectives, level of experience, and risk appetite, and seek professional advice where needed.
Fusion Media would like to remind you that the data contained in this website is not necessarily real-time nor accurate. The data and prices on the website are not necessarily provided by any market or exchange, but may be provided by market makers, and so prices may not be accurate and may differ from the actual price at any given market, meaning prices are indicative and not appropriate for trading purposes. Fusion Media and any provider of the data contained in this website will not accept liability for any loss or damage as a result of your trading, or your reliance on the information contained within this website.
It is prohibited to use, store, reproduce, display, modify, transmit or distribute the data contained in this website without the explicit prior written permission of Fusion Media and/or the data provider. All intellectual property rights are reserved by the providers and/or the exchange providing the data contained in this website.
Fusion Media may be compensated by the advertisers that appear on the website, based on your interaction with the advertisements or advertisers.
© 2007-2024 - Fusion Media Limited. All Rights Reserved.