Get 40% Off
💰 Buffett reveals a $6.7B stake in Chubb. Copy the full portfolio for FREE with InvestingPro’s Stock Ideas toolCopy Portfolio

Weekly Gold: All Bets Are Off

Published 05/08/2013, 01:54 PM
Updated 07/09/2023, 06:31 AM
GC
-
RED
-
NOTE
-
CTPC
-
SME
-

Gold spent the last 2.5 years in an undeniably obvious uptrend, supported by the white trend line shown below. That, of course, changed quickly this year as gold prices broke below the trend line… then the 100-day moving average (red)… then the horizontal support at $1,550 (red line).

Sentiment
Gold sentiment has changed dramatically… more on that below. My technical take is simple: until gold futures retake the horizontal red line at $1550, which I view as the key pivot point, I remain in the bearish camp.
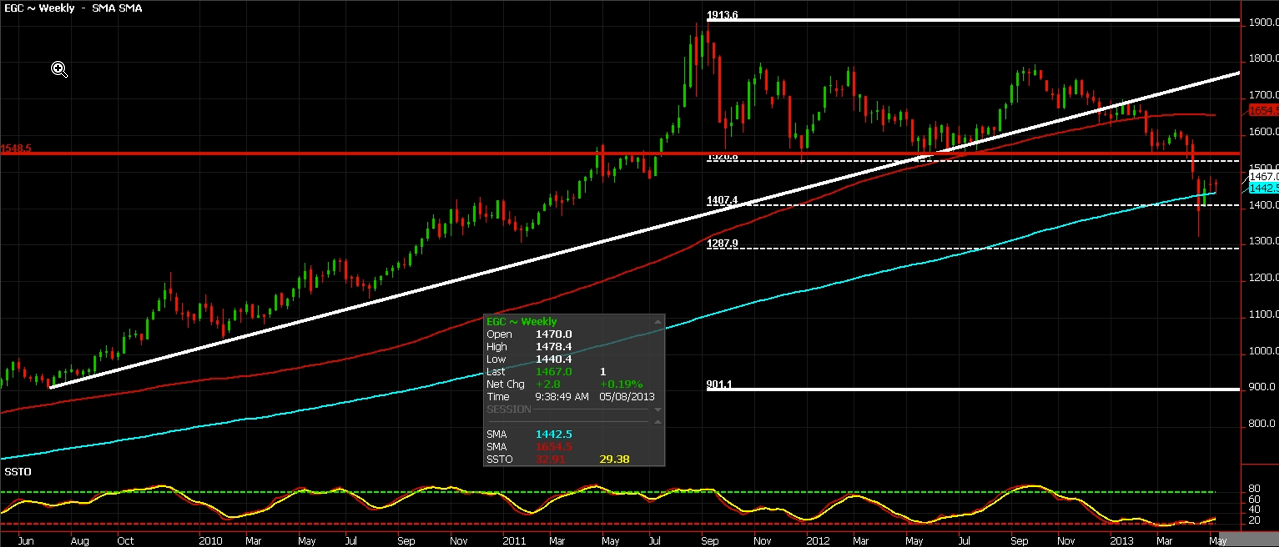
Gold Futures
What Changed?
A confluence of factors has worked to take the shine out of gold:

  • China’s economy is growing slower than previously anticipated.
  • Concerns have grown over the possibility that Cyprus, and other Euro zone members, may need to sell their gold holdings to cover a bailout.
  • Margin pressure likely caused investors to throw the baby out with bath water as a trade south induced an exaggerated short term move. Beware - this could happen again.
  • Goldman Sachs listed a bearish call on gold just prior to the selloff.
  • Gold no longer seems the safe haven play it used to.
  • Bulls likely got exhausted by the 16 months of agonizing sideways price consolidation.
  • Deflation, not inflation, looks to be possible ahead.
  • Investor sentiment has weakened across the board for metals as many investors drink the equity markets Kool-Aid.
Anything's Possible

Turning back to the technicals, the line in the sand is now the 200-day MA (light blue line). At this juncture, I cannot rule out lower trade dragging prices back under $1400. It’s even feasible we’ll see a 61.8% retracement in the coming weeks, putting futures under $1300/ounce. Clients who agree with this bearish view have lightly bought back ratio spreads in August with the aim of capitalizing on a potential 10% further depreciation.

Ending on an interesting historical note: there have been 13 bear markets in gold since 1975. The average bear market in gold has retraced 14%.


If the current selloff continues, a 14% pullback would put prices under $1300/ounce. Trade accordingly…

3rd party Ad. Not an offer or recommendation by Investing.com. See disclosure here or remove ads .

Latest comments

Agree. Golds going down back to its long term mean. Now that the Lemmings have realised things have whatever value they ascribe to them. Investment should never be made on the fear of something, which is Golds entire basis. Those that favour a return to Gold standard, just think about all the wasted resources, the pollution and harm to the environment this bloated sector entails. Trading with Gold is entirely impractical for obvious reasons. Gold down to $1422 - first target. Bottom between $300 & $700. Your insight/commentary is always interesting Matthew.
Risk Disclosure: Trading in financial instruments and/or cryptocurrencies involves high risks including the risk of losing some, or all, of your investment amount, and may not be suitable for all investors. Prices of cryptocurrencies are extremely volatile and may be affected by external factors such as financial, regulatory or political events. Trading on margin increases the financial risks.
Before deciding to trade in financial instrument or cryptocurrencies you should be fully informed of the risks and costs associated with trading the financial markets, carefully consider your investment objectives, level of experience, and risk appetite, and seek professional advice where needed.
Fusion Media would like to remind you that the data contained in this website is not necessarily real-time nor accurate. The data and prices on the website are not necessarily provided by any market or exchange, but may be provided by market makers, and so prices may not be accurate and may differ from the actual price at any given market, meaning prices are indicative and not appropriate for trading purposes. Fusion Media and any provider of the data contained in this website will not accept liability for any loss or damage as a result of your trading, or your reliance on the information contained within this website.
It is prohibited to use, store, reproduce, display, modify, transmit or distribute the data contained in this website without the explicit prior written permission of Fusion Media and/or the data provider. All intellectual property rights are reserved by the providers and/or the exchange providing the data contained in this website.
Fusion Media may be compensated by the advertisers that appear on the website, based on your interaction with the advertisements or advertisers.
© 2007-2024 - Fusion Media Limited. All Rights Reserved.