US Dollar Fundamental Analysis:
After last week’s busy agenda on the calendar, the US dollar is now up for a quieter week, which investors will likely use to digest last week’s slightly positive but largely mixed news. The ISM manufacturing PMI index was weaker than expected while the ISM services PMI was better than expected. The FOMC statement confirmed that the Fed is on track to raise rates again in June and judged the recent slowdown in the US economy as transitory.
The jobs data was also better than expected for the most part except wage growth on a year over year basis which was slower than forecasted, and it seems traders chose to focus on that piece of the data because the US dollar actually fell on the news despite strong job growth and a fall in the unemployment rate.
In the near future, it remains for the US economic data to justify the rate hikes from the Fed by showing stronger growth than in the first quarter.
This week the main focus will be on the inflation and retail sales data on Friday. If weaker than forecasted the reports could further undermine the US dollar.
One thing to keep in mind about the US dollar is that it’s now transitioning to a high-yielding currency and as such we are likely to see it rally in times of risk appetite against the low-yielding currencies (primarily the euro and the yen at the moment).
EUR/USD:
Fundamentals
The Macron victory against Le Pen in the second round of the French presidential election is no surprise to markets and consequently, we see the euro falling during the Asian session on Monday.
Last week’s reports showed continued improvement in the Eurozone economy and as a result the main question on traders’ minds now is when the ECB will start to taper their quantitative program. Further improvements in the economy will put even more pressure on the ECB to start the tapering process and consequently, that will put upward pressure on the euro and the EUR/USD pair.
However, there is always the possibility that the ECB disappoints the euro bulls again by being overly dovish and not signaling a taper at their next meeting, which would be bearish for EUR/USD.
This week’s most important events on the calendar are the German GDP and CPI reports as well as ECB President Draghi speech on Wednesday.
Technicals
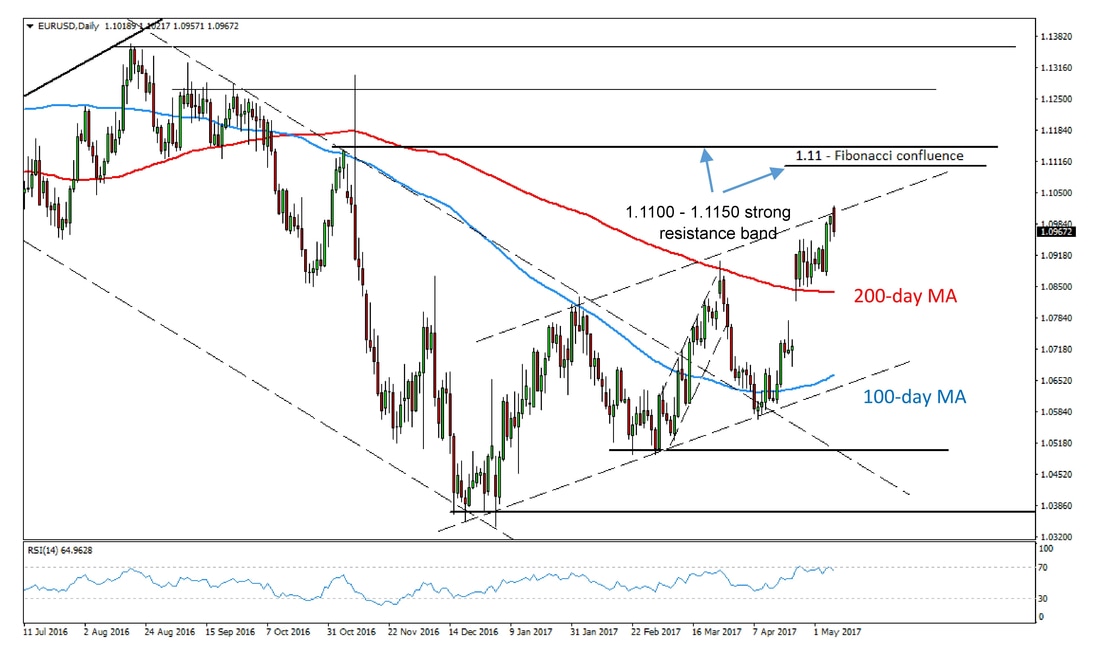
EUR/USD is currently trading at resistance provided by the upper border of the bullish channel (shown on the chart). The price has previously penetrated this trendline so it could even break above it.
Higher, the 1.1100 – 1.1150 resistance band stands. 1.1100 is a confluence Fibonacci resistance zone, while 1.1150 is resistance from the early November high.
The RSI reading is at 69 on the daily timeframe, suggesting that this move up is now somewhat stretched.
If the market reverses, to the downside the 1.0880 – 1.0900 previous resistance would now be support.

EUR/USD Daily chart – Resistance is not far while the RSI signals overbought levels
GBP/USD:
Fundamentals
Last week’s PMI reports again showed the resilience of the UK economy against the backdrop of a Brexit and why the UK is still far from a recession.
This week’s central stage will take the Bank of England meeting and inflation report. Given the still solid UK economy, it would not be surprising if the Bank of England tilts to the hawkish side, we might even see a few members of the committee voting for a rate hike. This would be immensely bullish for the pound and GBP/USD.
However, this is still a high-risk event for trading because GBP/USD will also fall sharply if the BOE is dovish by focusing on the risks to the economy rather than the improvements.
Technicals
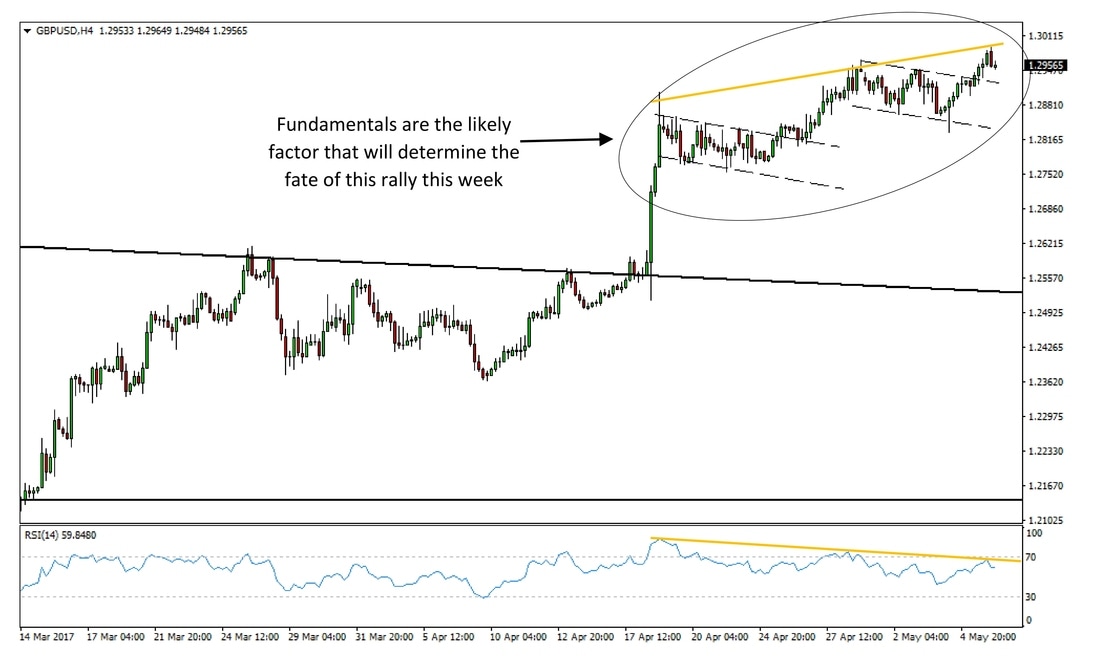
GBP/USD ended the previous week marginally higher after first falling to the 1.2830 – 1.2850 support.
The daily chart is not changed much since last week. While there is no resistance until the 1.3125 Fibonacci zone, momentum oscillators start to point to overbought levels.
On the 4 hour chart we can see divergence between the price and the RSI momentum signaling we should be cautious of this rally (marked by the orange lines).
To the downside, support is at 1.2850, 1.2750, 1.27 and 1.26.
GBP/USD 4h chart - The uptrend has been impressive but momentum is recently waning
USD/JPY
Fundamentals
No major reports are scheduled from Japan and therefore USD/JPY will likely trade based on the US dollar and US fundamentals, US bond Yields and the risk appetite – risk aversion barometer in markets.
Meanwhile, inflation continues to run persistently below the BOJ’s target. Governor Kuroda in response has recently pledged that the BOJ will continue to pursue the target by maintaining the pace of monthly asset purchases until inflation is at the 2% goal.
Technicals
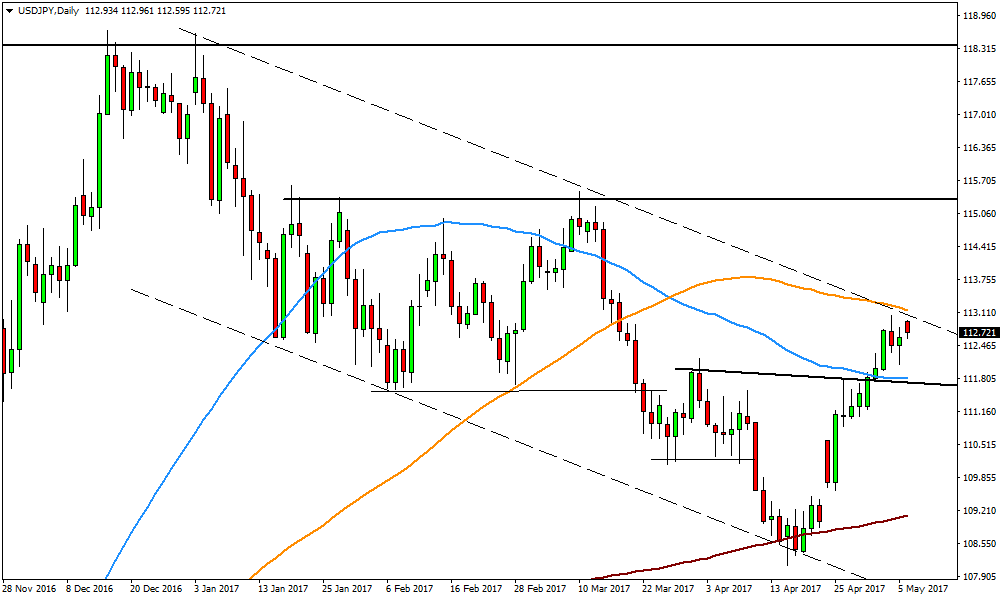
USD/JPY is now stuck between support at 111.80 provided by the 55-day moving average (blue line) aided by the previous highs (trendline), and resistance at the 113 – 113.20 area provided by the 100 - day moving average (orange line) aided by the resistance trendline of the channel (dotted lines).
This suggests that USD/JPY will likely pause here even if it breaks higher later. A break of the channel to the upside will open the way for a quick move to the 115.50 resistance level.
On the other hand, a break below 111.80 would open the way to 111 and 110.50.

USD/JPY Daily chart - In between support and resistance
