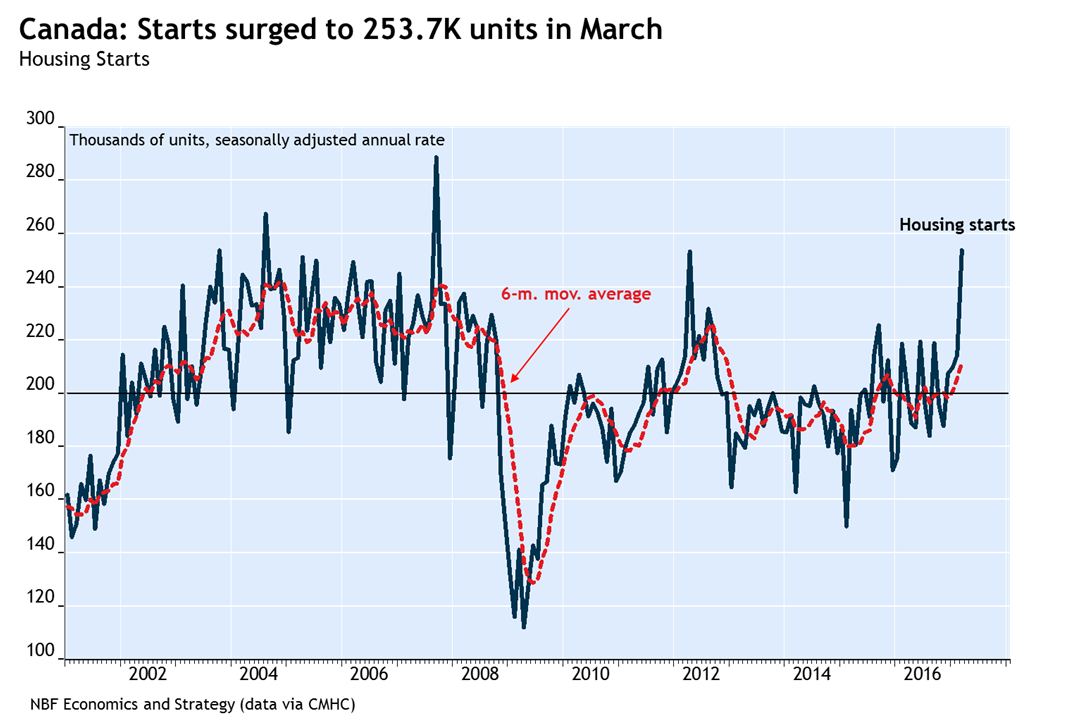
CANADA: Housing starts soared to an annualized 253.7K in March, their highest level since September 2007. Most of the increase came from urban multiples, which sprang 37.3K units (+30.2%) to 161.0K. Single-detached urban starts rose 2.2K (+3.1%) to 74.7K. Rural starts edged down 0.1K units (-0.3%) to 18.0K. On a regional basis, starts increased 16.8K in British Columbia, 13.2K in Quebec, 8.6K in Alberta, and 4.4K in Ontario. In Toronto, starts were up 16.6K (all in condo and rental units). In the rest of Ontario, however, they declined 11.7K to a more normal level after three months of intense activity. The recent surge in house prices in Toronto and in most of the other Ontario urban areas should encourage homebuilders to continue constructing new dwellings at a brisk pace. Accordingly, we have revised up our housing starts forecast for Canada in 2017 to 203K units, above the 198K level reached last year. Meanwhile, starts in Q1 shot up an annualized 73% over Q4’s levels and thus contributed strongly to economic growth.

The Teranet–National Bank National Composite House Price IndexTM rose 0.9% in March, its largest gain for that month in the past ten years. The increase was attributable to four of the 11 metropolitan markets surveyed: Hamilton (+2.1%), Toronto (+1.8%), Victoria (+1.0%) and Vancouver (+0.9%). Prices rose also in Winnipeg (+0.6%) and Montreal (+0.5%) but declined in the other five markets covered. On a year-overyear basis, the national index was up 13.5%, its largest 12- month gain since November 2006. The surge was driven by Toronto (a record +24.8%), Hamilton (a record +21.5%) and Victoria (+18.0%). Prices fell in Edmonton (-2.8%) and Quebec City (−2.8%). In the Toronto market, which has attracted the most media attention, large price gains are no longer restricted to single-family homes. Indeed, condo prices were up a stunning 17% year on year in March.
Overall, prices have surged 25% in the city, a phenomenon that cannot be fully explained by increases in employment and household formation. Although the Toronto market has been the talk of the town lately, home prices are also rising in several other cities. Indeed, indexes based on the same Teranet-National Bank methodology were calculated for 15 cities not currently covered by the Composite. We found double-digit home price inflation in 11 of them. This means that, together with the metropolitan areas covered by the Composite, 58% of the 26 markets surveyed experienced double-digit home price inflation in the past 12 months. This record proportion is very similar to that observed in the United States in 2005 at the peak of the market.
To read the entire report Please click on the pdf File Below
