REVIEW
One impressive rally this week! The week started off at SPX 1887. After a notable pullback to SPX 1882 the market rallied straight up to 1949 by Wednesday. Then after a pullback to SPX 1927 on Wednesday, the market rallied to 1965 to end the week. For the week the SPX/Dow gained 3.35%, the NDX/NAZ gained 5.60%, and the DJ World index gained 3.10%. On the economic front things were not as rosy, as positive reports nudged out negative ones. On the uptick: existing home sales, the CPI, the FHFA index and leading indicators. On the downtick: new home sales, the WLEI, plus weekly jobless claims rose. Next week is FOMC week! Plus we get reports on Q3 GDP, the PCE and the Chicago PMI.
LONG TERM: bull market
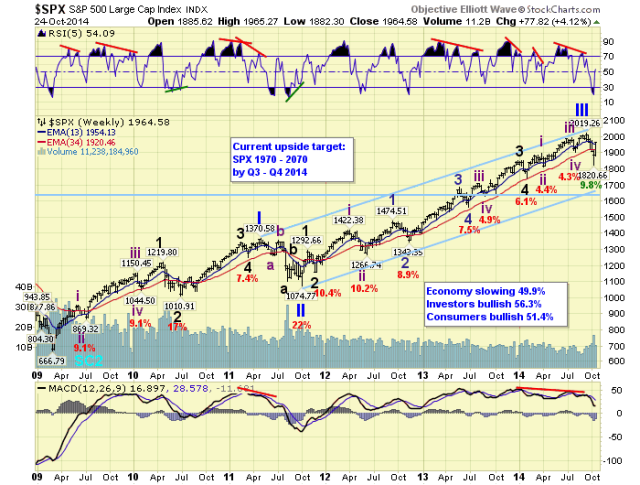
The five Primary wave Cycle wave [1] bull market continues to unfold. We continue to count: Primary waves I and II ending in 2011, Primary III ending in September with Primary IV underway since then. After the SPX 2019 high five weeks ago Friday, the market started to work its way lower for about one week and a half. After that, and since then, it has become quite volatile. With the DOW moving triple digits nearly every day. This type of volatility usually occurs only in corrections.

When reviewing the Primary II correction in 2011 one should notice that it unfolded in a five wave elongated flat: abA-B-C. Using alternation as a guide we have been expecting a simple zigzag for Primary IV. Basically, the first three waves of Primary II should suffice for a Primary IV correction. After this weeks strong rally we took a closer look at those three waves back in 2011.
The first wave down, labeled Int. a, took several weeks as the market lost 8.2%. The RSI got quite oversold, and then the market started to rally in Int. b. During the rally, which took a few weeks, the market had one week in which it surged +5.2%. The market then went sideways before dropping in Int. wave c. The total decline for Primary II was 22%. During Primary IV were are observing similar activity. The first decline took several weeks as the market lost 9.8%. After getting quite oversold, the market started to rally in a b wave. This week the market surged 4.1% during this rally. They certainly look quite similar.
MEDIUM TERM: Major B uptrend awaiting confirmation
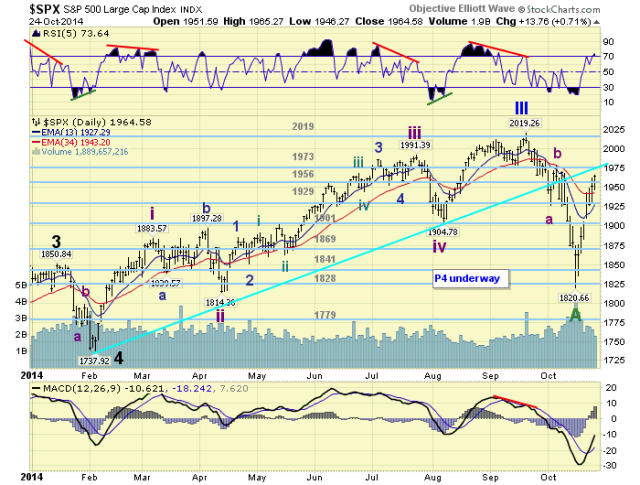
After Primary wave III topped at SPX 2019 we observed an Int. wave a down to SPX 1926. Then we had an Int. wave b rally to SPX 1978. After that the market got quite volatile. After a drop to SPX 1925, the market rallied in one day to SPX 1970. The next day it totally reversed, giving back nearly all of that gain. After that the market went down, in a series of corrective waves, until it reached SPX 1821. At that point Int. c was a near perfect 1.618 relationship to Int. a.

With the market then quite oversold it started to rally. After the first day we noted the characteristics of the market had changed, and suggested Major wave B was underway. We also suggested the OEW 1973 pivot range would probably be the upside target. However, we expected the advance to be quite choppy. The rally started off choppy, SPX 1821-1898, but then took off to the upside after a pullback to SPX 1878. At first we thought the uptrend would be three Int. waves subdividing into three Minor waves. When the market cleared the 1956 pivot on Friday we updated the charts to display Int. A at SPX 1898, Int. B at 1878, and Int. C underway. When this last rally concludes, Major wave B should conclude, and a potentially nasty Major wave C downtrend should follow. Medium term support is at the 1956 and 1929 pivots, with resistance a the 1973 and 2019 pivots.
SHORT TERM
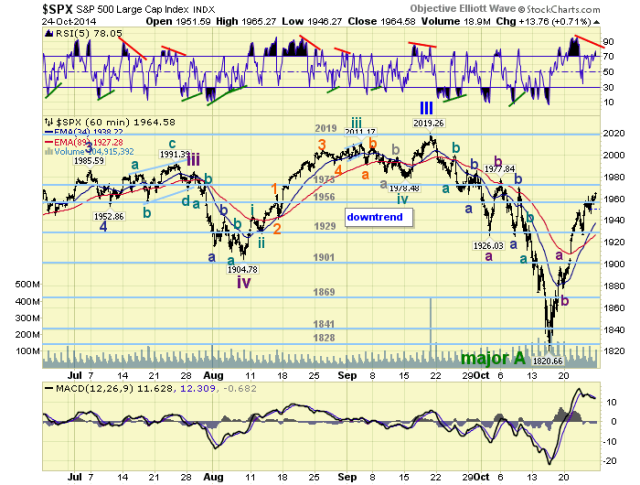
During the Major wave A downtrend we noted the decline was occurring in a series of seven waves sets. The market was quite volatile and making notable waves several times a day. The last decline was also seven waves into the SPX 1821 low. And then suddenly the market changed its characteristics. As the rally progressed from the low it was quite volatile, but after several days it started to settle down. At the peak of the volatility, into the low and coming out of it, we counted ten waves on each of those two days.

We noted during the week that we have been observing seven wave patterns again on the way up during this uptrend. These patterns have been much larger than during the decline. The first rally, Int. A, unfolded: 1869-1835-1868-1852-1876-1857-1898. Then after an Int. wave B pullback to 1878, Int. C has unfolded as follows: 1892-1882-1949-1927-1962-1946-1965+. Two sets of seven wave patterns, with the second set yet to complete. Our upside target has been the OEW 1973 pivot range, so we expect this last rally to top within the 1966-1980 range. Of note, Int. wave B of Major wave A ended at SPX 1978. Short term support is at the 1956 and 1929 pivots, with resistance at the 1973 and 2019 pivots. Short term momentum continues to form a negative divergence as the market has worked its way higher. The first 10 point reversal off of any high could suggest the top has been achieved.