
Equities
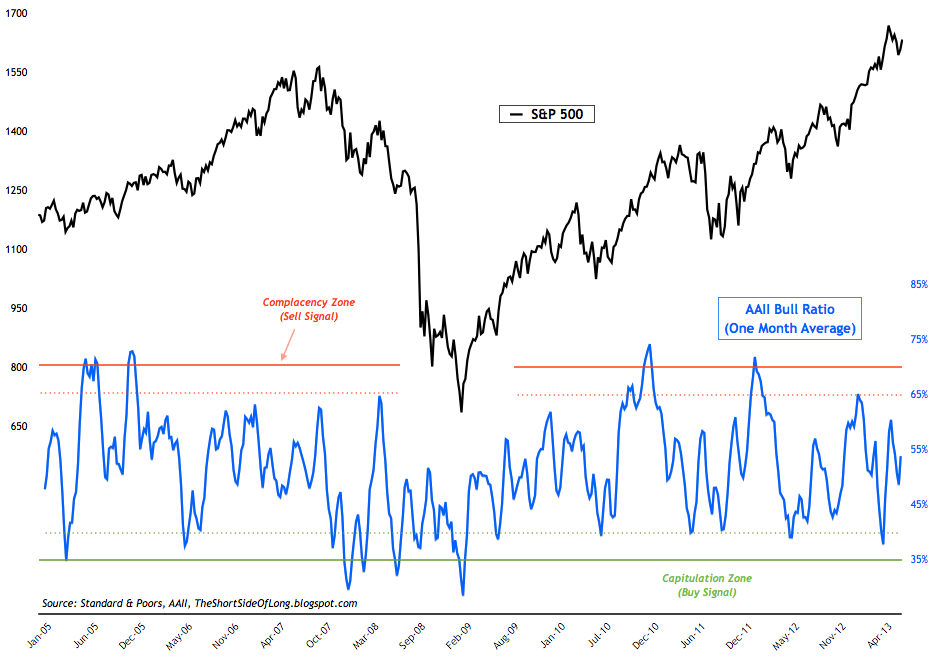
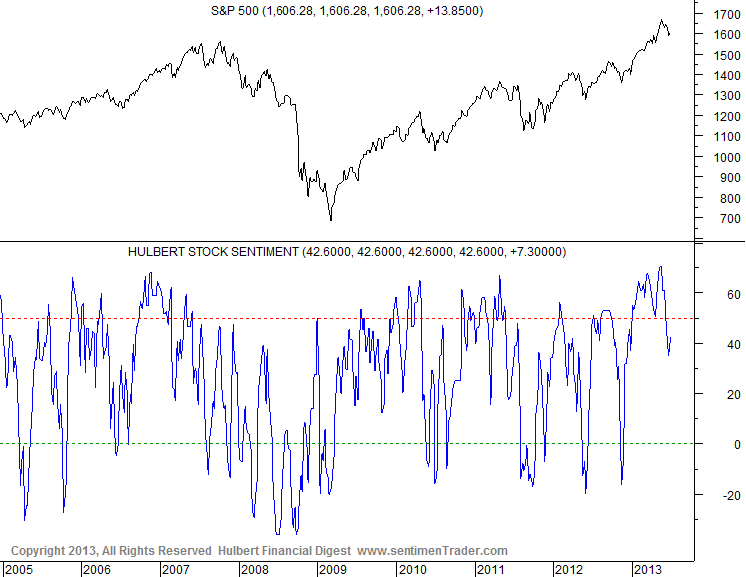
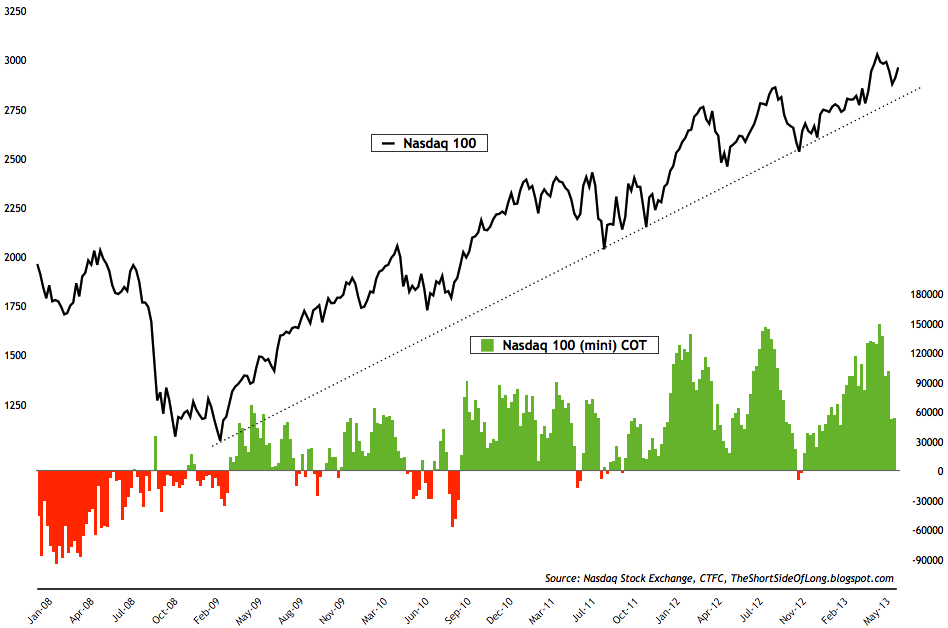
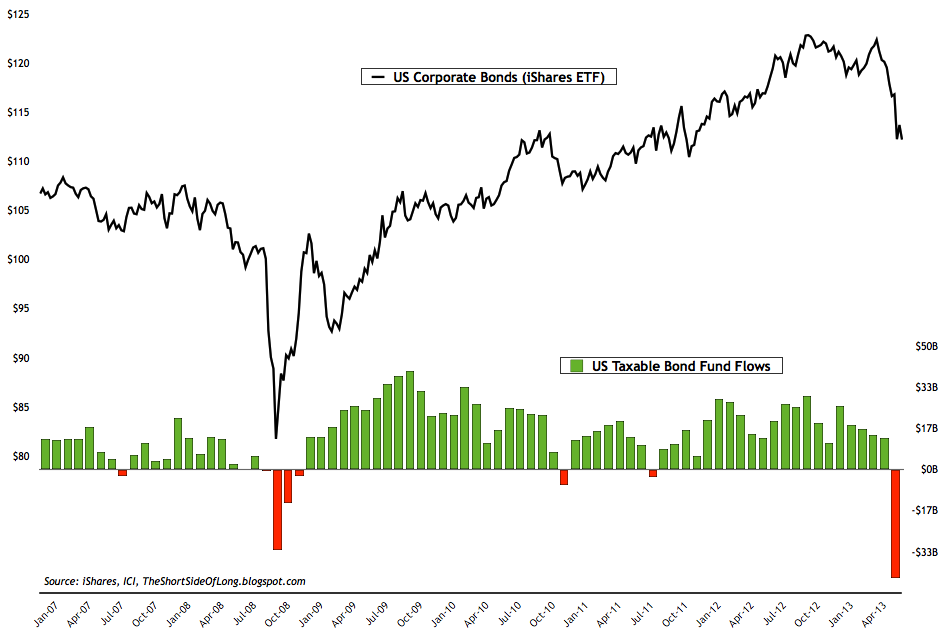
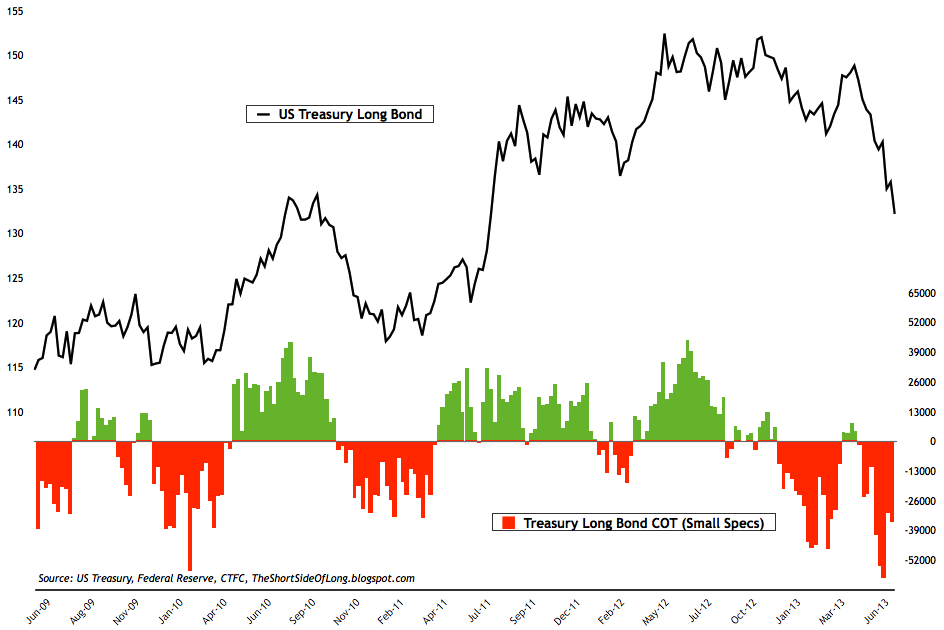
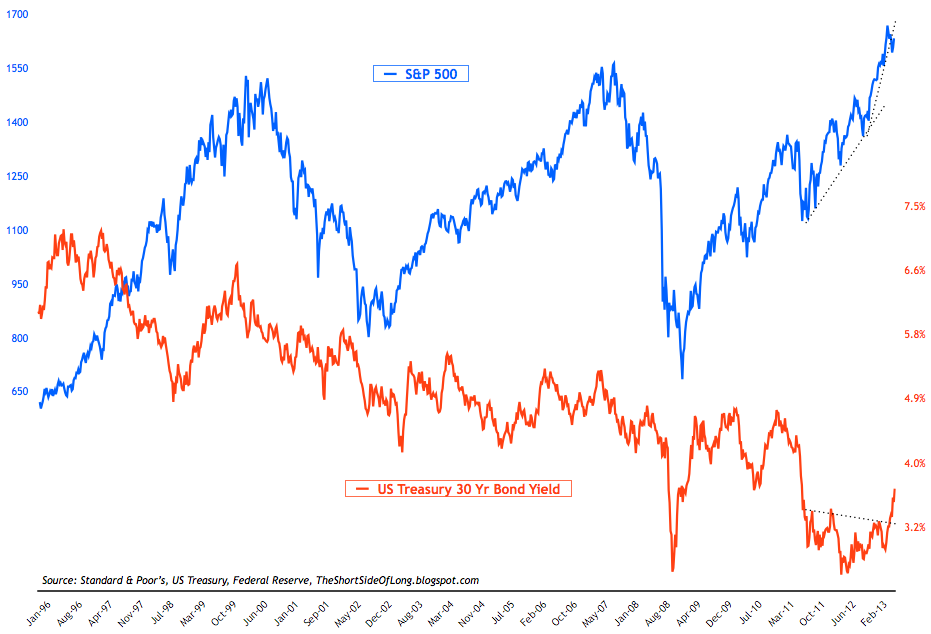
Chart 7: Funds have reduced their commodity exposure past the '08 lows
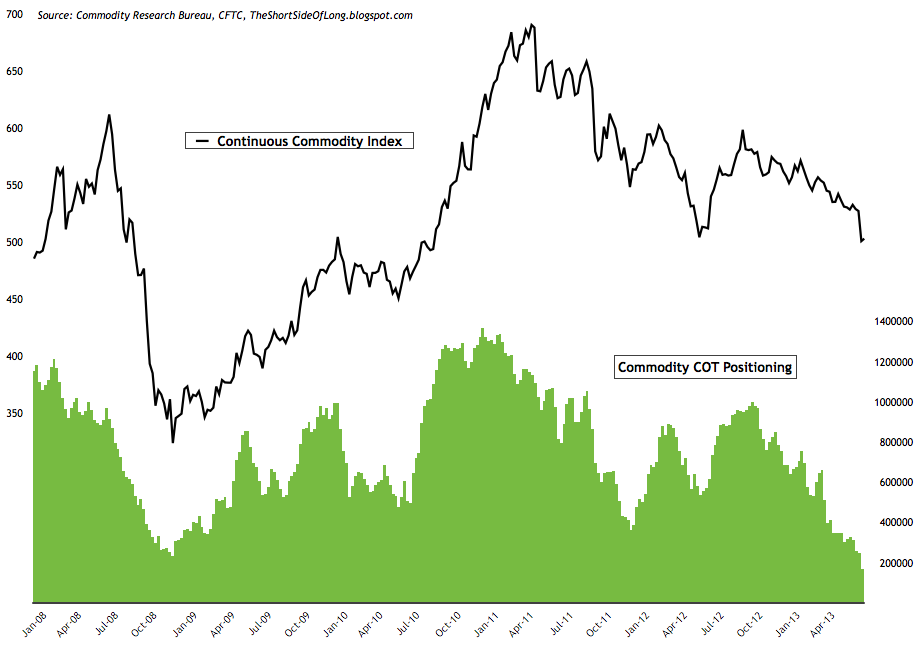
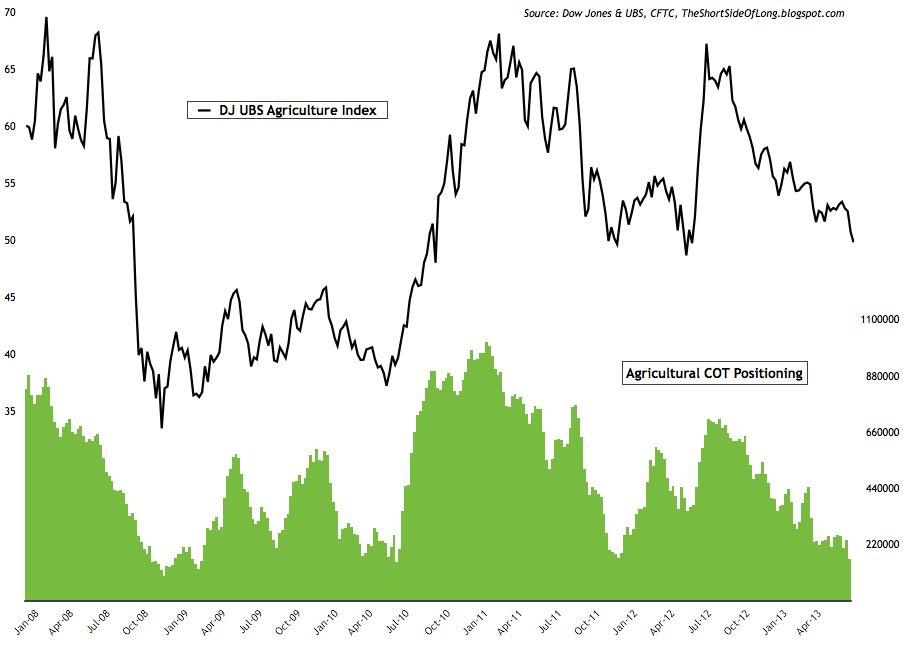
Chart 9: Speculators have been whipsawed by the recent Dollar volatility
- Due to the Independence Day holiday, last week's COT report was released on Monday and therefore I waited until Tuesday morning (Asian time) to do the following sentiment post.
- AAII survey readings came in at 42% bulls and 24% bears. Bullish readings rose by 12% while bearish readings fell by 11%. The AAII bull ratio (4 week average) currently stands at 53%, still dead smack in the middle of the historical range. At the same time, AAII asset allocation survey showed that retail investors decreased their equity exposure by 3% to 62.1%, while cash levels increased 4% to 20.7%. For referencing, AAII Cash Allocation survey chart can be seen by clicking clicking here.
- Investor Intelligence survey levels came in at 44% bulls and 21% bears. Bullish readings rose by 2%, while bearish readings fell by 4%. II bull ratio has fallen only slightly from the previous extremes as it currently stands at 68%. For referencing, recent chart of the II bull ratio chart can be seen by clicking clicking here.
- NAAIM survey levels came in at 40% net long exposure, while the intensity rose slightly towards 50%. It is worth noting that in early parts of 2013, this sentiment indicator reached a record high levels. The reading has mean reverted in recent weeks, however we are no where near a panic, which would flash a contrarian buy signal. For referencing, recent NAAIM survey chart can be seen by clicking clicking here.
- Other sentiment surveys have also started to pull back from recent extremely bullish readings seen through the month of May and June. Consensus Inc survey & Market Vane survey are reverting back towards the mean now, however we are no where near extreme bearish readings worthy of contrarian "buy signals". Hulbert Newsletter Stock Sentiment, seen in the chart above, shows that advisors still recommend over 42% net long exposure towards US equities. While readings have pulled back from bullish extremes, we are also not yet near a panic, which would flash a contrarian buy signal.
- This weeks ICI fund flows report showed "equity funds had estimated inflows of $169 million for the week, compared to estimated inflows of $1.98 billion in the previous week. Domestic equity funds had estimated outflows of $962 million, while estimated inflows to world equity funds were $1.13 billion." When it comes to global equity fund flows, the evidence still points to retail investor optimism. Monthly outflows from a global perspective are not yet seen in the data. On the other hand, Rydex fund flows have pulled back from extremely high bullish inflows witnessed only several weeks ago. The Nova Ursa fund flow indicator has fallen to a ratio of 27 from the ratio of 45. While the short term buy signal was triggered a week ago, a long term buy signal is by and large a long way away, as Nova Ursa ratio would have to drop as low as 10 (like in March 2009, July 2010 and October 2011). For referencing, recent Rydex fund flow chart can be seen by clicking clicking here.
- Last weeks commitment of traders report (released yesterday) showed that hedge funds and other speculators held similar bets to last weeks data. While the exposure reached as high as 150,000 net long contracts several weeks ago, readings on the US tech equities has now fallen back to 54,000 net long bets. Once again, reduction of outright bullish sentiment is evident, but we are no where near a buy signal just yet.
- Bond sentiment surveys are nearing pessimistic territory, with certain surveys now reaching extreme pessimism. Market Vane survey & Hulbert Newsletter Bond survey are turning more negative but are not yet at the panic levels, while Consensus Inc survey has now reached extreme downside levels with only 28% bulls (historically readings of 25% to 30% bulls have marked intermediate degree bottoms). The sell off has been strong within the bond asset class, and it has not spared the Treasury market, the Munis, the emerging market bonds and nor the corporate or junk bond debt.
- This weeks ICI fund flows report showed "bond funds had estimated outflows of $28.12 billion, compared to estimated outflows of $7.97 billion during the previous week. Taxable bond funds saw estimated outflows of $20.45 billion, while municipal bond funds had estimated outflows of $7.68 billion." The data above shows a huge swing in retail investor sentiment. Consistently, month after month, we have seen bonds as the favourite asset class by retail crowd (especially corporate and junk bond space where inflows have been record breaking). The situation has now changed with recent sharp sell off on the back of "tapering hints" by the Fed, which has crashed bond prices and panicked the fixed income investment community.
- Last weeks commitment of traders report (released yesterday) shows that small speculators remain net short the Treasury Long Bond market, however the readings are not yet near extremes. This weeks positioning came in at 35,600 net short bets, which is almost half of the recent 60,000 net short position seen only a few weeks ago. The government bond market has plummeted in recent weeks, as I have been stating in previous reports that a downtrend of lower highs and lower lows seems to have established itself. Under this condition, net short bets can persist just as long as net long bets persisted during an uptrend from February 2011 until June 2012.
- As a quick side note away from sentiment readings, let us quickly focus on the chart above, which shows US stocks vs bonds. From a technical perspective, it seems that the bond yields have established some kind of a base from which they have broken out on the upside. In previous instances, the rise in yields (fall in bonds) has supported US stocks as a counter pair trade. However, US stocks have outperformed just about every asset class over the last few quarters and have recently risen in a parabolic manner. This makes them extremely overvalued in the medium term. Could both stocks and bonds enter a correction stimiitanously? And if so, what asset class would benefit under these conditions?
Chart 7: Funds have reduced their commodity exposure past the '08 lows
- Last weeks commitment of traders report (released yesterday) showed that hedge funds and other speculators reduced commodity net long bets dramatically for the second week running. Cumulative net long exposure currently stand at 167,000 contracts tracked by my custom COT aggregate, which is the lowest positioning level since at least 2001. Hedge fund exposure was dramatically reduced in agriculture, and in particular within the grains. Investors are panic selling Corn in particular. Energy exposure stayed similar from previous week, while metal exposure once again fell.
- It has been obvious for awhile now that agricultural commodities have been out of favour. If it wasn't for the drought in 2012, grains would have not rallied as high. The rise in grains last year masked the underlying weakness in the sector, as all commodities continue to be under pressure. This is very evident in prices of soft commodities like Sugar, Coffee, Cotton and Orange Juice. Please note that last weeks COT report showed that hedge funds reduced their cumulative agricultural commodity exposure to some of the lowest levels in a decade.
- Commodity Public Opinion surveys still remain near their bearish extremes, however in most commodities, investors are not in outright panic just yet. Expectation to this rule, where sentiment is extremely negative, are commodities such as Copper, Cocoa, Coffee, Lumber and Sugar. While I do not consider them commodities, precious metals like Gold, Silver and Platinum fall into this extremely pessimistic category too (more on that below).
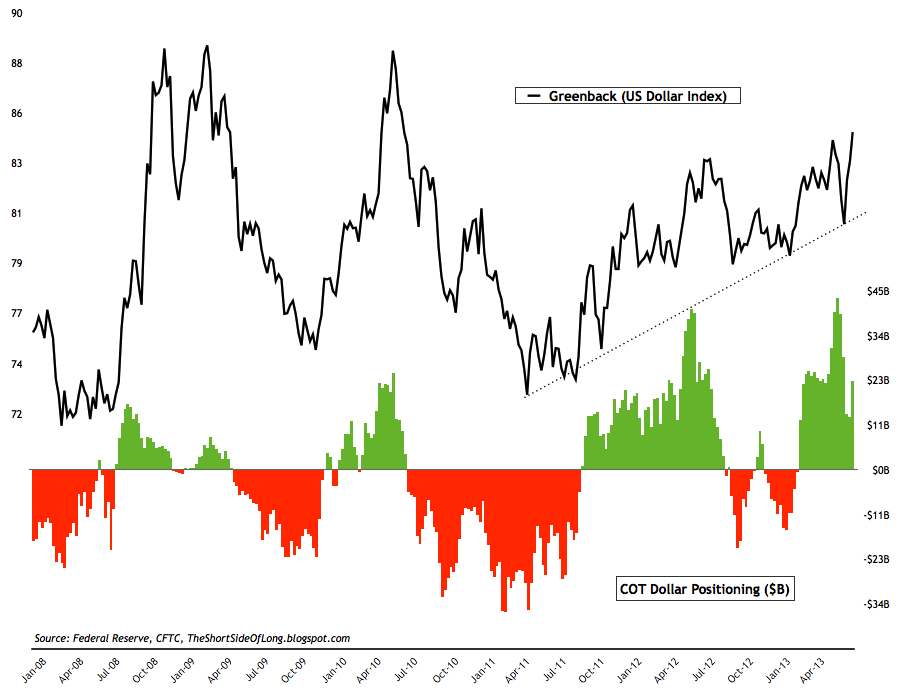
Chart 9: Speculators have been whipsawed by the recent Dollar volatility
- Last weeks commitment of traders report (released yesterday) showed exposure towards the US Dollar almost doubled from a previous week, from $13.3 billion towards $22.3 billion. The US Dollar volatility has been high, with a sharp correction followed by an even sharper rally towards new 52 week highs. Investors are puzzled at the direction of the greenback, but as long as the uptrend line holds (shown in the chart above), King Dollar will keep rallying. Hedge funds hold short bets against all foreign currencies from Euro and Yen all the way to Aussie Dollar, where positioning has reached another record high net short.
- Currency Public Opinion survey readings on the US Dollar have once again started rising towards bullish extremes, but still not there just yet. At the same time, Public Opinion on the foreign currencies has fallen. In particular, investors dislike the Pound, the Euro, the Yen and the Canadian Dollar.
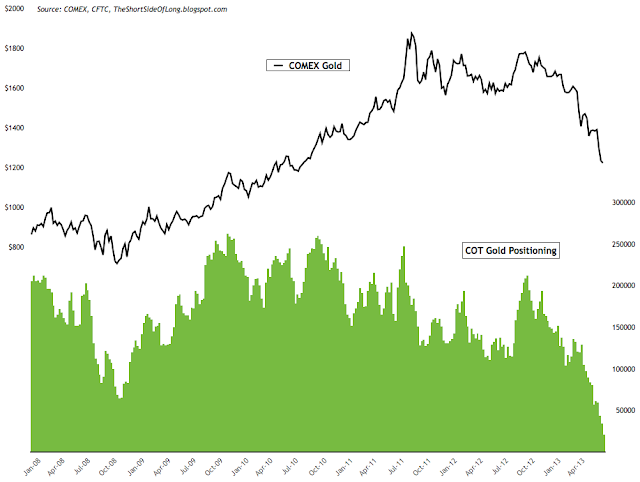
- Last weeks commitment of traders report (released yesterday) showed hedge funds and other speculators continuously keep on reducing precious metals exposure. Hedge fund positions on Gold remain at a decade low of 20,700 net longs, while in Silver positioning remains at extremely low 4,600 net longs. Gold net long positioning is currently at 5.5 percent of overall open interest, while Silver's is at 5.7 percentage points. This is extremely low (and a contrarian buy signal) as historically Gold's net long positions as a percentage of open interest can reach as high as 70% plus and has usually averaged around 44% mark.
- Public opinion on alternative currencies like Gold and Silver continues to remains depressed, which is confirming the ultra bearish COT reports discussed above. Sentiment can stay negative for a prolonged period of time during bear markets the same way it can remain positive for a prolonged period of time during bull markets. However, it should be noted that sentiment is ultra bearish and a sharp rebound can occur at any point in time.