
Macroeconomic overview:
- 2017 has seen a downward correction in the USD. It has been aided by the US administration’s ongoing messy handling of politics and the pickup in growth in the rest of the world, but the fact of the matter is that the greenback had long been substantially and stubbornly overvalued.
- In 2018 our central scenario envisages further USD depreciation – albeit slower, as the gravitational pull of overvaluation is now weaker than it was a year ago.
- In our view, the upward USD move since early September of this year is largely attributable to technical reasons. The build-up of extreme dollar short positioning eventually led speculative investors to square some of these positions as short-term indicators were flagging stretched/overbought conditions. However, underlying fundamentals have not changed. If anything, cleaner positions should whet investors’ appetites to re-engage in “short dollar” trades again before too long.
- Additionally, our call for a lower dollar is in line with historical norms at similar stages of the Fed’s tightening cycle (we expect that we are currently mid-way through the hiking path). More often than not, the USD tends to peak at the beginning of the hiking cycle but starts depreciating as the target rate increases, most likely because the growing maturity of the business cycle, in combination with tighter financial conditions, start weighing on growth and growth expectations at home.
- Admittedly this is not a typical tightening cycle, but the dollar depreciation so far last year seems to suggest that this historical pattern remains at play.
- And the implementation of US tax reform is unlikely to turn things around this time. Tax cuts should produce a modest temporary boost to growth but will not fundamentally alter the long-term trajectory of the economy. In fact, it is not at all clear whether these measures will have any positive effect on the dollar. Ultimately, it is a plan that foresees deterioration in domestic fiscal balances without even attempting to address the US productivity issue. Fundamentally, the widening of the deficit should actually be dollar-negative.
- Of course there are both upside and downside risks to our scenario.
- Any development that puts downside pressure on sentiment and global risk appetite would lead to “flight to safety” and likely cause dollar strength, mostly against high-beta and liquid emerging-market FX. In such an environment, JPY would strengthen – as a risk-off trade – while the implications for the euro are less clear given that the currency’s correlation with risk assets has varied greatly over time. An escalation of tensions between Saudi Arabia and Iran (or any other geopolitical risk flaring up) poses perhaps the most immediate risk to our bearish dollar forecasts, mostly – in this case - against high-beta risk sensitive currencies. Other risks that could lead to a resumption of dollar strength include a pronounced Chinese growth slowdown (potentially triggered by the Chinese authorities moving too aggressively to curb credit growth) and/or US growth/inflation surpassing our expectations, prompting the Fed to tighten more aggressively.
- On the other hand, dollar downside could accelerate if the slowdown in the US arrives earlier than we expect. In this scenario, EUR could appreciate at a faster clip – at least initially – as the market starts pricing out some Fed rate tightening, and the yen would get a further boost higher.
- Turning to the EUR, we forecast further gains in 2018 and extending into 2019. Our target for end-2018 is at 1.28 and 1.32 for end-2019. Relative to forwards we are more bullish. We see three arguments that support our constructive view.
- The process of EUR/USD convergence to equilibrium has started and has further to run. This is underpinned by persistently strong economic tailwinds and the pricing out of political risk premiums. A notable feature is that investment as a percentage of GDP in the Eurozone is rising, but remains below pre-2007 levels. This has two immediate implications from an FX perspective: first, it highlights robustness in good underlying fundamentals, increasing conviction in our call for more EUR upside; and second, as investment (one of the cornerstones of our fair valuation framework) continues to be on an upward trend, moving towards higher historical averages, there will be a tendency for EUR/USD fair value to increase (moderately) further, putting more upside pressure on spot.
- The market is now relatively well placed and priced for the gradual normalization in Fed policy. This implies that the typical cyclical currency response to FOMC tightening (USD peaks as investors gear up for monetary policy tightening but generally weakens as it gets underway) is in full swing. In contrast, ECB tapering has only recently been announced and implementation will start in January 2018. Though this withdrawal of monetary policy accommodation will be a very gradual process, it still signals an end to ultra expansionary policy. Since the announcement, rates in the euro area have declined which is suggestive of a mispricing that should (admittedly, gradually) correct. In other words, the divergence in US-Eurozone monetary policies should be less pronounced in 2018 and 2019 than it has been over the last two years. This should be good for EUR/USD.
- Since late 2016, there has been convincing evidence that portfolio flows are returning to the euro area following years of foreign investors sharply reducing their exposure to the region’s assets. This process is far from over as the portfolio balance (outflows minus inflows) is still far from its long-run average and remains out of sync with the improved economic outlook and lower region-specific political risk. The return of portfolio money – especially into the equity market – should be an additional factor supporting the exchange rate.
- Risks are broadly balanced. Upside risks stem mostly from the possibility of euro overshooting – a typical feature of previous cycles – during which EUR/USD closes the undervaluation gap and then rises prominently above fair value as market momentum overpowers fundamentals in the short-to-medium term. This time, the ECB’s inclination to keep EUR gains capped will prevent a fast and significant overshooting, though it still represents a risk. On downside risks, the possibility of a faster Fed tightening cycle in case US growth/inflation surprise on the upside could halt or reverse last year’s EUR appreciation.
Technical analysis:
- The EUR/USD broke above 1.1960, November 27 high and psychological resistance at 1.2000. The next hurdle is 1.2092 high on September 8.
- We stay long for 1.2150, just below 50% fibo of 2014-2017 drop.

TRADING STRATEGIES SUMMARY:
FOREX - MAJOR PAIRS: 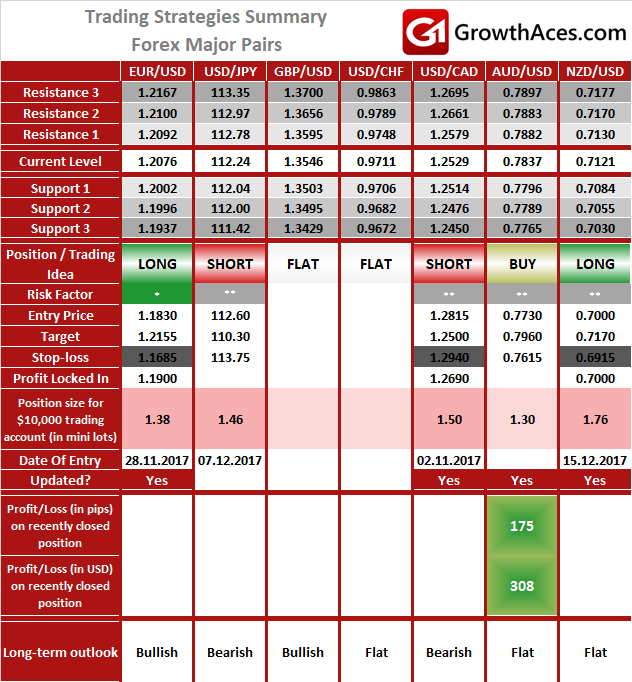
FOREX - MAJOR CROSSES: 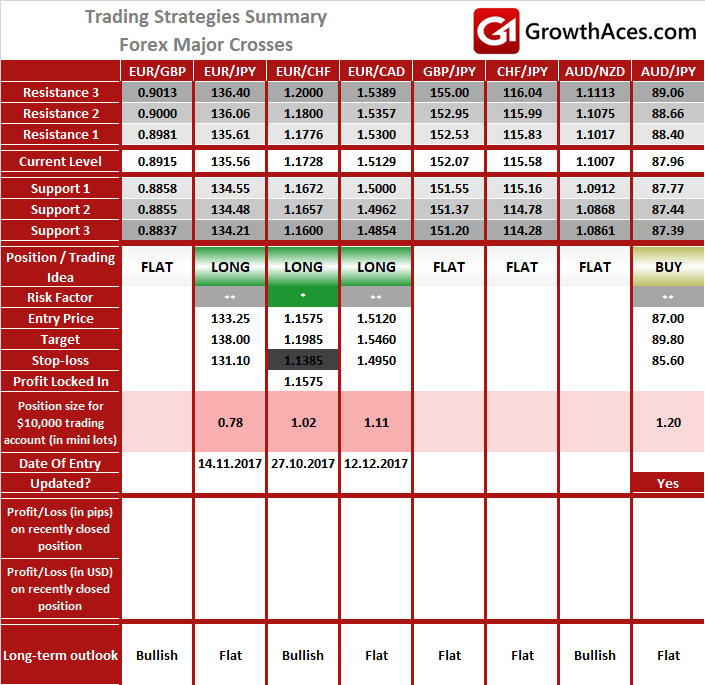
PRECIOUS METALS: 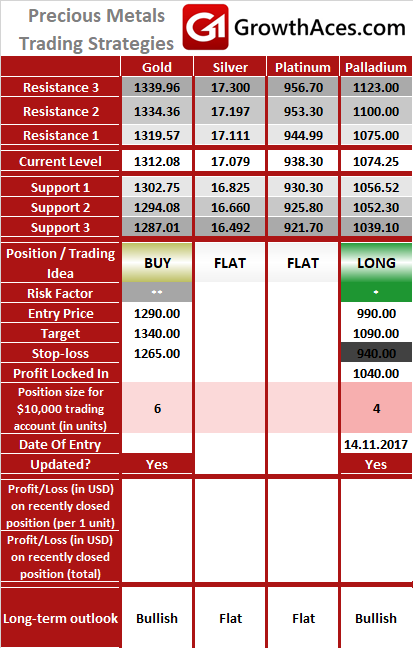
How to read these tables?
1. Support/Resistance - three closest important support/resistance levels
2. Position/Trading Idea:
BUY/SELL - It means we are looking to open LONG/SHORT position at the Entry Price. If the order is filled we will set the suggested Target and Stop-loss level.
LONG/SHORT - It means we have already taken this position at the Entry Price and expect the rate to go up/down to the Target level.
3. Stop-Loss/Profit Locked In - Sometimes we move the stop-loss level above (in case of LONG) or below (in case of SHORT) the Entry price. This means that we have locked in profit on this position.
4. Risk Factor - green "*" means high level of confidence (low level of uncertainty), grey "**" means medium level of confidence, red "***" means low level of confidence (high level of uncertainty)
5. Position Size (forex)- position size suggested for a USD 10,000 trading account in mini lots. You can calculate your position size as follows: (your account size in USD / USD 10,000) * (our position size). You should always round the result down. For example, if the result was 2.671, your position size should be 2 mini lots. This would be a great tool for your risk management!
Position size (precious metals) - position size suggested for a USD 10,000 trading account in units. You can calculate your position size as follows: (your account size in USD / USD 10,000) * (our position size).
6. Profit/Loss on recently closed position (forex) - is the amount of pips we have earned/lost on recently closed position. The amount in USD is calculated on the assumption of suggested position size for USD 10,000 trading account.
Profit/Loss on recently closed position (precious metals) - is profit/loss we have earned/lost per unit on recently closed position. The amount in USD is calculated on the assumption of suggested position size for USD 10,000 trading account.