Walgreen Co. (Walgreen), together with its subsidiaries, operates a drugstore chain in the United States. The Company provides its customers with multichannel access to consumer goods and services, and pharmacy, health and wellness services in communities across America.
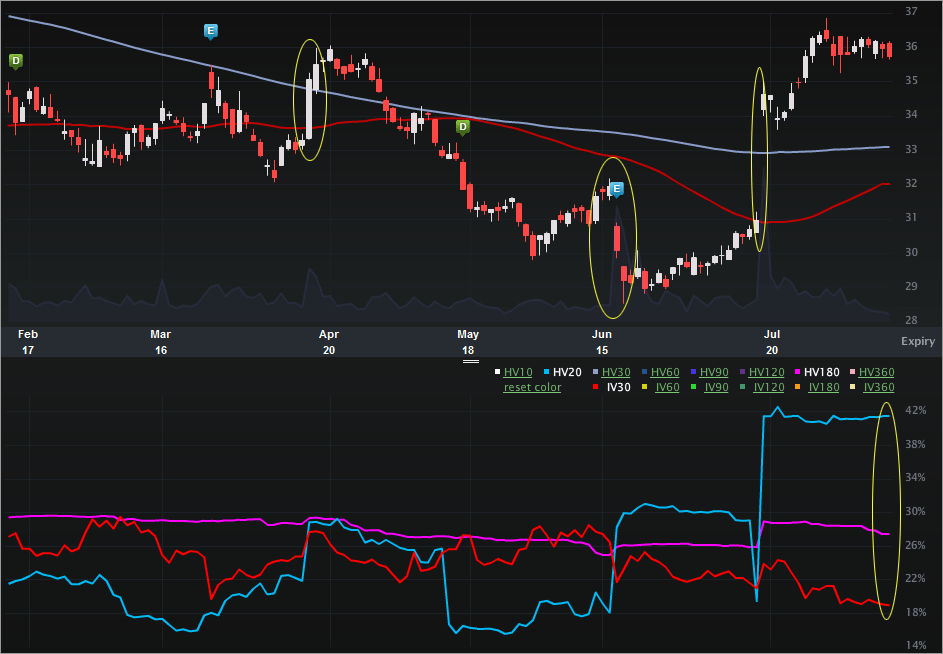
I know I don't normally write about 19 vol stocks, but this one caught my attention in an otherwise slow day. Let's start with the Charts Tab (six months), below. The top portion is the stock price, the bottom is the vol (IV30™ - red vs HV20™ - blue vs HV180™ - pink).
On the stock side, we can see how volatile the ride has been. Here are the three moves I've highlighted:
4-17-2012: Stock went from $33.30 to $35.07, up 5.3%.
6-18-2012 --> 6-20-2012: Stock went down from $31.96 to $29.21, down 8.6% on earnings.
7-19-2012: Stock went up from $30.97 to $34.62, up 11.8%.
Here's a news snippet from that day:
LOS ANGELES (MarketWatch) — Shares of Walgreen Co. made double-digit percentage gains Thursday after the drug retailer announced it had ended a seven-month dispute with Express Scripts Holding Co. and will now start to take the pharmacy-benefit manager’s customers.
Investors bid the shares nearly 12% higher in recent action to $34.62, rallying as Walgreen (US:WAG) brought the feud to a halt. Express Scripts (US:ESRX) also climbed, adding nearly 2% to $58.76.
But the peacemaking had a detrimental effect on shares of CVS Caremark Corp. (US:CVS) and Rite Aid Corp. (US:RAD), Walgreen’s rivals.
Rite Aid tumbled by more than 6% to $1.20, while CVS Caremark also dropped more than 6% to $45.43. The two companies had been taking Express Scripts customers away from Walgreen.
Source: Marketwatch via Yahoo! Finance; Walgreen soars as dispute ends, but rivals fall, written by Russ Britt.
So, in totality, the stock has had some volatile days. Looking to the vol portion of the Charts Tab, though, we can see how depressed the implied is to both the short-term and long-term historical realized vols. Before today, the 52 wk range in IV30™ was [19.09%, 46.38%], so the level today is a new annual low. In fact, it's at least a two year low. Granted, the Express Scripts dispute ended n' stuff, but still, a multi-year vol low right now... It makes sense, yet is noteworthy, if that makes any sense.
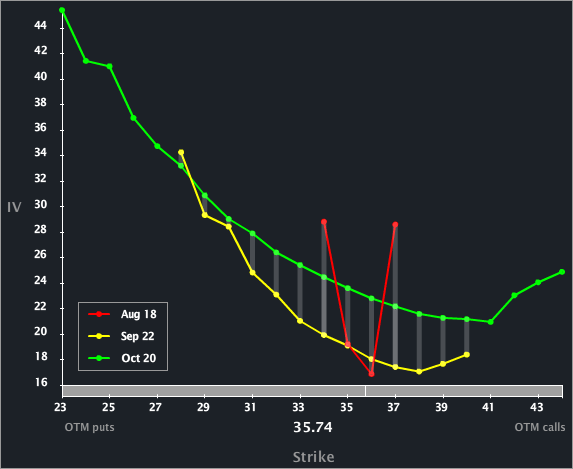
Let's turn to the Skew Tab to examine the line-by-line and month-to-month vols. 
The skew is normal, with the back two expiries demonstrating a normal skew shape and the front showing a parabolic shape, which isn't uncommon three and a half trading days from expo.
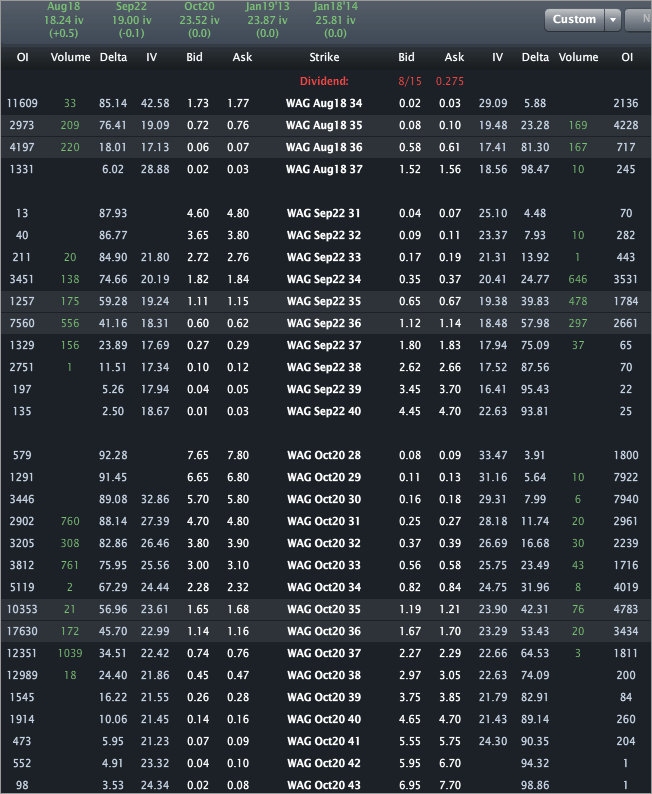
Finally, let's turn to the Options Tab for completeness.
We can see the monthly vols across the top are priced to 18.24%, 19.00% and 23.52%, respectively for Aug, Sep and Oct. An interesting set up could be to follow the trend with low vols and fund an earnings month long option position with front month sales and then rolling them after each expo. I'm not saying this is a good trade, I'm just trying to add some color.
This is trade analysis, not a recommendation.
- English (UK)
- English (India)
- English (Canada)
- English (Australia)
- English (South Africa)
- English (Philippines)
- English (Nigeria)
- Deutsch
- Español (España)
- Español (México)
- Français
- Italiano
- Nederlands
- Português (Portugal)
- Polski
- Português (Brasil)
- Русский
- Türkçe
- العربية
- Ελληνικά
- Svenska
- Suomi
- עברית
- 日本語
- 한국어
- 简体中文
- 繁體中文
- Bahasa Indonesia
- Bahasa Melayu
- ไทย
- Tiếng Việt
- हिंदी
Walgreen (WAG) - Vol Hits Multi-Year Lows Following Dispute Settlement
Published 08/15/2012, 03:49 AM
Updated 07/09/2023, 06:31 AM
Walgreen (WAG) - Vol Hits Multi-Year Lows Following Dispute Settlement
3rd party Ad. Not an offer or recommendation by Investing.com. See disclosure here or
remove ads
.
Latest comments
Install Our App
Risk Disclosure: Trading in financial instruments and/or cryptocurrencies involves high risks including the risk of losing some, or all, of your investment amount, and may not be suitable for all investors. Prices of cryptocurrencies are extremely volatile and may be affected by external factors such as financial, regulatory or political events. Trading on margin increases the financial risks.
Before deciding to trade in financial instrument or cryptocurrencies you should be fully informed of the risks and costs associated with trading the financial markets, carefully consider your investment objectives, level of experience, and risk appetite, and seek professional advice where needed.
Fusion Media would like to remind you that the data contained in this website is not necessarily real-time nor accurate. The data and prices on the website are not necessarily provided by any market or exchange, but may be provided by market makers, and so prices may not be accurate and may differ from the actual price at any given market, meaning prices are indicative and not appropriate for trading purposes. Fusion Media and any provider of the data contained in this website will not accept liability for any loss or damage as a result of your trading, or your reliance on the information contained within this website.
It is prohibited to use, store, reproduce, display, modify, transmit or distribute the data contained in this website without the explicit prior written permission of Fusion Media and/or the data provider. All intellectual property rights are reserved by the providers and/or the exchange providing the data contained in this website.
Fusion Media may be compensated by the advertisers that appear on the website, based on your interaction with the advertisements or advertisers.
© 2007-2024 - Fusion Media Limited. All Rights Reserved.
