Venezuela and Washington D.C.’s appetite for destruction seems set to boost the background fundamentals of the oil and gold rallies.
Oil
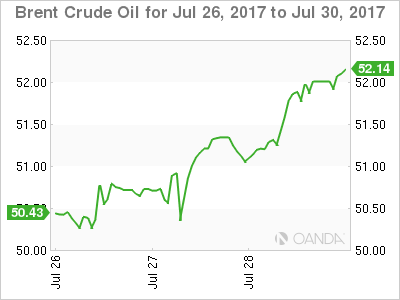
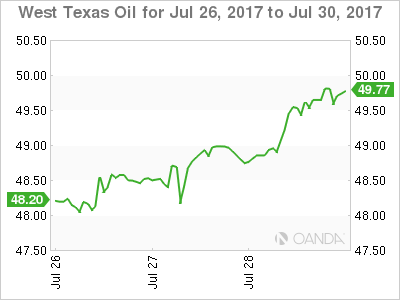
Oil enjoyed a very bullish close to the week with both Brent and WTI climbing some two percent, with both closings comfortably above their respective 100-day moving averages. A combination of factors seems to be driving the newly found optimism. U.S. Inventories are showing massive drawdowns, Saudi Arabia seems intent on playing its role as the world’s swing producer ahead of the Aramco IPO, impending sanctions on Venezuela by the U.S. will almost certainly be oil price supportive with a weaker U.S. dollar and conflict within Washington D.C. all lending a hand. There also appears to be less urgency by shale producers to hedge forward production for now which has snuffed out previous rallies.
Brent crude, in particular, bears watching. Having closed at 52.00 on Friday, the spot price is just below its 61.80% retracement of the drop from the 2017 high to lows which lie just above at 52.15. A close above here could imply a test of 52.70, with a break here opening a possible run at the May highs around 54.00 a barrel. Support today will appear at 51.40, the 100-day moving average.

WTI spot trades at 49.65, the high and closing level from Friday. Resistance will clearly be at the 50.00 level initially, with a daily close above suggesting a continuation of the rally to the May highs around 51.65. Support will appear at the 100-day moving average at 49.10 followed by the Friday low at 48.70.

Event wise Venezuela looms large today with only 12% of the population voting in an election marred by violence over the weekend and deemed illegal by the United States. The latter’s response will be critical to the short term direction of oil as the international community starts to circle the corpse of the Venezuelan economy.
Gold
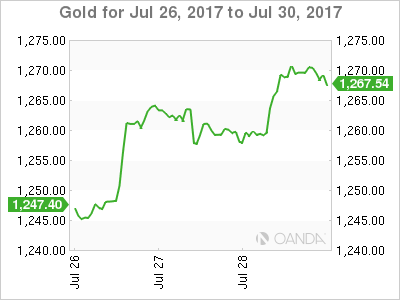
Gold raced higher by 12 dollars on Friday to close near its highs at 1269.00 to cap an excellent week for the yellow metal. A weaker U.S. dollar is the main driver if gold’s price action. However, deepening political turmoil in Washington D.C., and impending collapse in Venezuela and North Korea’s progress on ballistic missiles will all ensure the uncertainty premium continues to support gold’s price.
Gold is trading at 1269.00 in early Asia, just above its Friday close with the way clear on a technical basis, for a run at the early June highs just above 1280.00. Near term, support sits at 1265.00 and then 1257.00.
The only cloud on gold’s horizon could be a slightly overbought RSI, but technical traders are unlikely to break into a cold sweat unless we see a break of the 200-day moving average. It lies today at the 1250.50 level.
Again, Venezuela is the main event risk over the next 24 hours, as somewhat dubious and violence marred election over the weekend appears to be hastening the march to the bankruptcy of the country with the world’s largest proven oil reserves.

