Veeco Instruments Inc. (VECO) designs, manufactures and markets equipment to make light emitting diodes (LEDs), solar cells, hard-disk drives and other devices. The Company operates in two segments: Light Emitting Diode (LED) and Solar, and Data Storage.
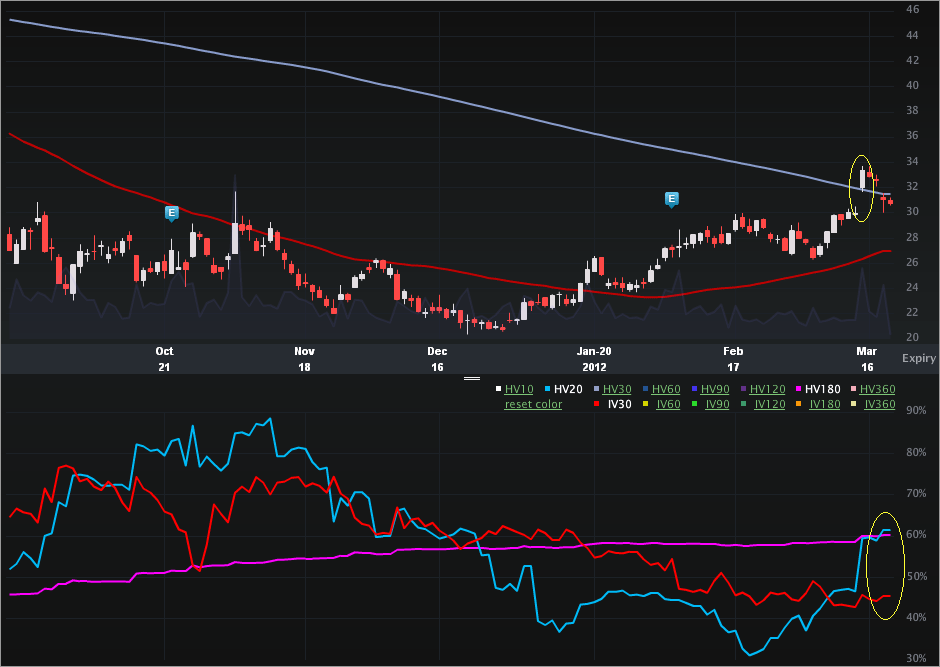
Thisis a vol note – specifically depressed vol as earnings approach. Let’s turn to the Charts Tab (six months), below. The top portion is the stock price, the bottom is the vol (IV30™ - red vs HV20™ - blue vs HV180™ - pink).
On the stock side, we can see some price appreciation over the last six months. I’ve highlighted 3-15-2012 when the stock closed up 11.4%. Here’s a news snippet from that day:
LED equipment maker Veeco Instruments (NASDAQ:VECO) soared today as Deutsche Bank (NYSE:DB) upped their rating to Hold, citing promising demand for LED lighting that could indicate an industry rebound.
Shares of the Somerset, New Jersey-based company gained as much as 11 percent today, adding to the company’s 44.1 percent increase for 2012. According to a report by the Motley Fool, Deutsche Bank also put a $40 price target on the stock, which represents more than 30 percent worth of upside to its Thursday closing price.
Source: WALL ST. CHEAT SHEET via Yahoo! Finance -- This Upgrade Fuels Veeco Instruments Rise, written by Gina Smith.
But, it’s the vol that really caught my attention. The 52 wk range in IV30™ is [40.97%, 80.92%] putting the current level in the 10th percentile (annual). The recent stock gap up has pushed HV20™ up "artificially." The current vol comps are:
IV30™: 45.55%
HV20™: 61.55%
HV180™: 60.22%
The last two earnings cycles in calendar Q2 for VECO have been 4-26-2010 and 4-25-2011. It’s a reasonable guess that the next earnings release will be in May expiry but outside of Apr.
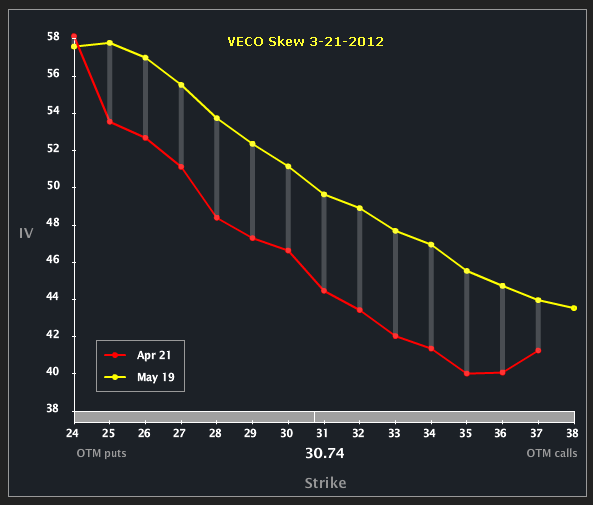
Let’s turn to the Skew Tab – we’ll find the confirming circumstantial evidence of the earnings date.
We can see that May vol lies above Apr for most strikes, with similar shapes across the months. A vol event is priced for May outside of Apr – aka: earnings.
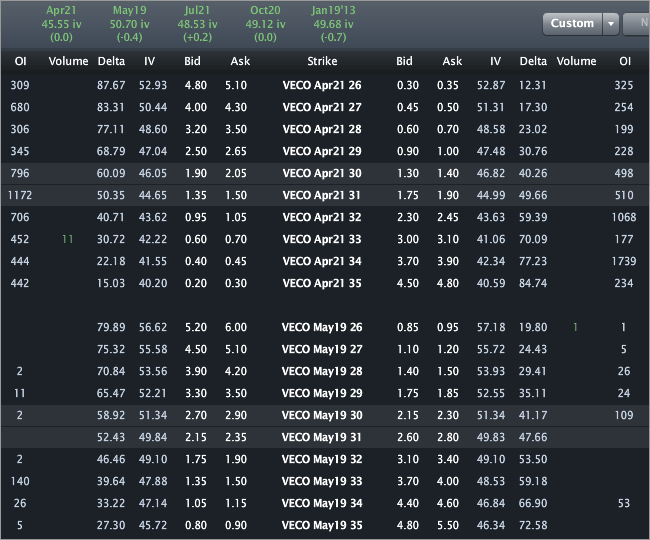
Let’s turn to the Options Tab.
I wrote about this one for TheStreet (OptionsProfits), so no specific trade analysis here. Across the top we can see that Apr and May are priced to 45.55% and 50.70%, respectively. That May number would be the 24th percentile (annual) – so still depressed both to the implied's history and to the historical realized measures.But, keep in mind, as recently as 3-5-2012, HV20™ was as low as 37.16%.
Still noteworthy is that last earnings cycle the IV30™ only hit ~54% and the stock moved just $0.22. The upgrade and projection does embed a sort of “risky” event, so it’s reasonable to bet that vol will rise into the earnings release above that prior level, but then again... it may not.
This is trade analysis, not a recommendation.
- English (UK)
- English (India)
- English (Canada)
- English (Australia)
- English (South Africa)
- English (Philippines)
- English (Nigeria)
- Deutsch
- Español (España)
- Español (México)
- Français
- Italiano
- Nederlands
- Português (Portugal)
- Polski
- Português (Brasil)
- Русский
- Türkçe
- العربية
- Ελληνικά
- Svenska
- Suomi
- עברית
- 日本語
- 한국어
- 简体中文
- 繁體中文
- Bahasa Indonesia
- Bahasa Melayu
- ไทย
- Tiếng Việt
- हिंदी
Veeco Instruments: Depressed Vol Into Earnings... Right?
Published 03/22/2012, 03:35 AM
Updated 07/09/2023, 06:31 AM
Veeco Instruments: Depressed Vol Into Earnings... Right?
3rd party Ad. Not an offer or recommendation by Investing.com. See disclosure here or
remove ads
.
Latest comments
Install Our App
Risk Disclosure: Trading in financial instruments and/or cryptocurrencies involves high risks including the risk of losing some, or all, of your investment amount, and may not be suitable for all investors. Prices of cryptocurrencies are extremely volatile and may be affected by external factors such as financial, regulatory or political events. Trading on margin increases the financial risks.
Before deciding to trade in financial instrument or cryptocurrencies you should be fully informed of the risks and costs associated with trading the financial markets, carefully consider your investment objectives, level of experience, and risk appetite, and seek professional advice where needed.
Fusion Media would like to remind you that the data contained in this website is not necessarily real-time nor accurate. The data and prices on the website are not necessarily provided by any market or exchange, but may be provided by market makers, and so prices may not be accurate and may differ from the actual price at any given market, meaning prices are indicative and not appropriate for trading purposes. Fusion Media and any provider of the data contained in this website will not accept liability for any loss or damage as a result of your trading, or your reliance on the information contained within this website.
It is prohibited to use, store, reproduce, display, modify, transmit or distribute the data contained in this website without the explicit prior written permission of Fusion Media and/or the data provider. All intellectual property rights are reserved by the providers and/or the exchange providing the data contained in this website.
Fusion Media may be compensated by the advertisers that appear on the website, based on your interaction with the advertisements or advertisers.
© 2007-2024 - Fusion Media Limited. All Rights Reserved.
