Get 40% Off
🎁 Free Gift Friday: Copy Legendary Investors' Portfolios in One ClickCopy for Free

USD/JPY’s Sudden Change Of Heart Explained

Published 11/18/2017, 11:48 PM

Not too long ago, on November 6th, the U.S. dollar climbed to as high as 114.73 against the Japanese yen, which was its highest level since mid-March. But instead of maintaining the bullish momentum, USD/JPY had a sudden change of heart and reversed to the south. Two trading weeks later, the pair closed slightly above the 112.00 mark after an intraday low of 111.94 on Friday, November 17th.

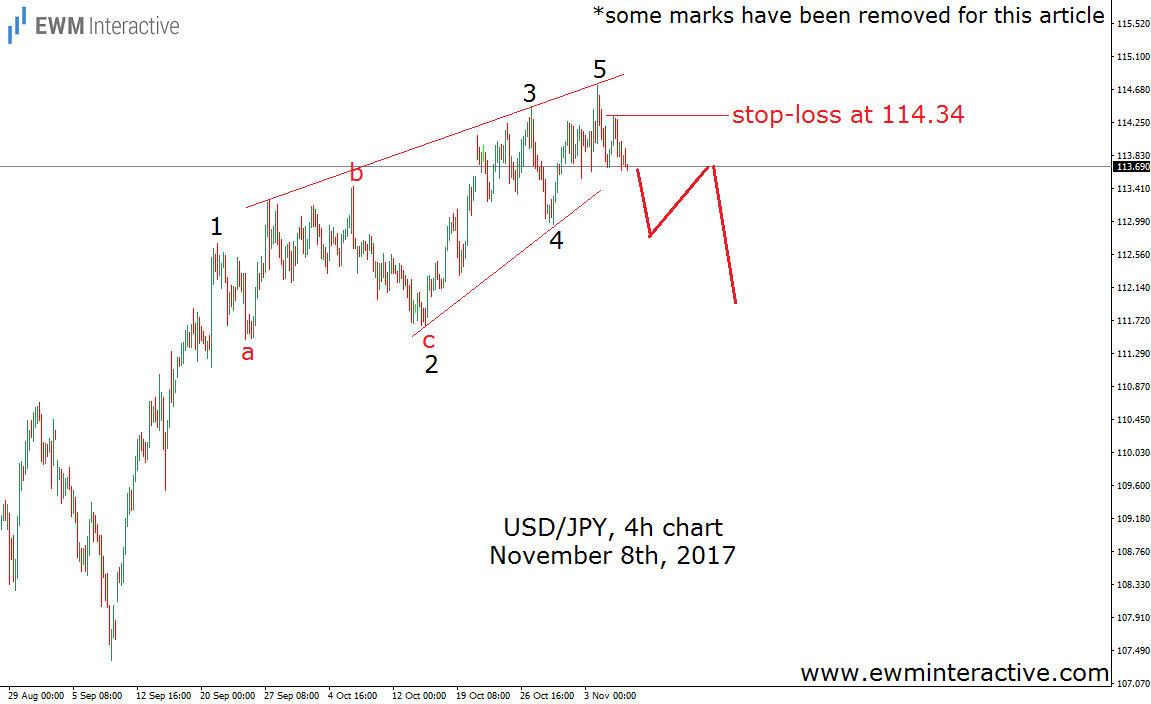
The good news is that the Elliott Wave Principle not only saved us the trouble to search for a reason for this 280-pip selloff, but also put us in the position to take advantage from the better part of it. The chart below was included in the mid-week update we sent to clients on Wednesday, November 8th.(some marks have been removed for this article)
USD/JPY 4hChart

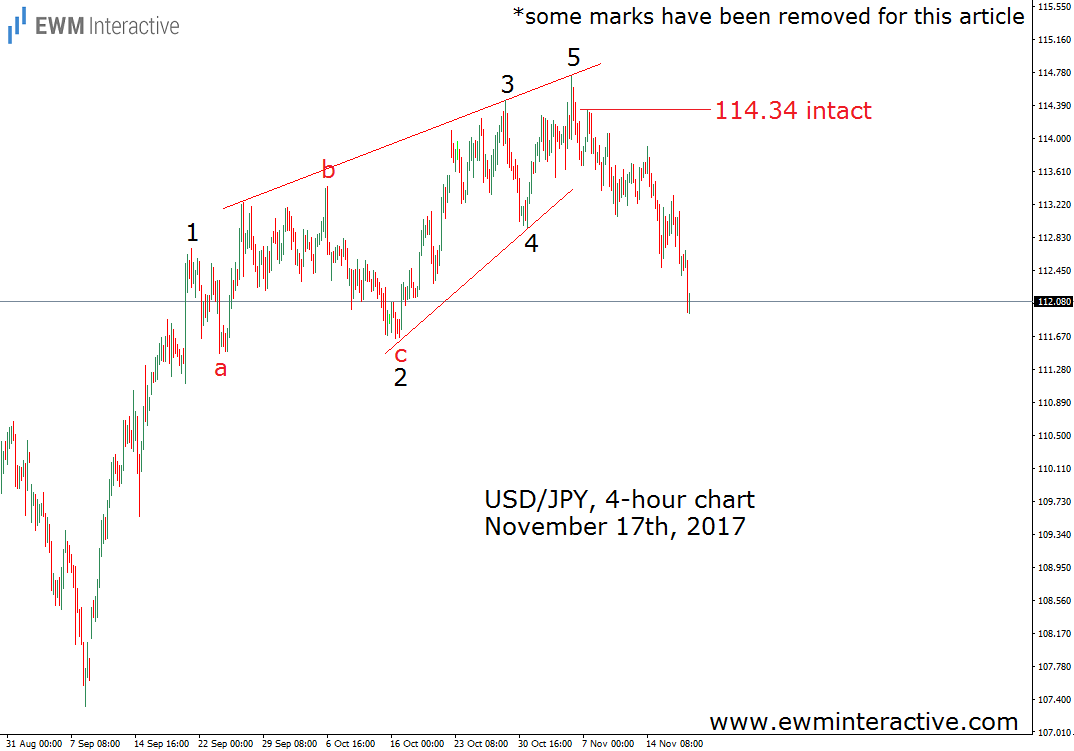
Truth is while USD/JPY was hovering near 114.70, we thought it would go higher, too. But the moment the upper line of the above-shown leading diagonal discouraged the bulls, we knew the rally has been postponed. Which, in turn, revealed a nice short setup, whose targets lied near the support area of wave 2 of the pattern. Furthermore, the Wave principle helped us identify a concrete stop-loss level, in order to reduce the risk. As long as 114.34 was intact, lower levels were anticipated. The chart below shows how USD/JPY has been developing.
USDJPY 4 Hour Chart

First, the all important 114.34 was far from danger the whole time. The rate continued to make lower highs and lower lows until it slightly breached the 112.00 mark yesterday. Once again, Elliott Wave analysis demonstrated its ability to put traders ahead of the news. Besides, the import-export relations between the United States and Japan did not matter, and neither did we have to pay much attention to the US House of Representatives passing the tax reform bill, because a single chart was all a technical analyst needs.

3rd party Ad. Not an offer or recommendation by Investing.com. See disclosure here or remove ads .

Original post

Latest comments

Risk Disclosure: Trading in financial instruments and/or cryptocurrencies involves high risks including the risk of losing some, or all, of your investment amount, and may not be suitable for all investors. Prices of cryptocurrencies are extremely volatile and may be affected by external factors such as financial, regulatory or political events. Trading on margin increases the financial risks.
Before deciding to trade in financial instrument or cryptocurrencies you should be fully informed of the risks and costs associated with trading the financial markets, carefully consider your investment objectives, level of experience, and risk appetite, and seek professional advice where needed.
Fusion Media would like to remind you that the data contained in this website is not necessarily real-time nor accurate. The data and prices on the website are not necessarily provided by any market or exchange, but may be provided by market makers, and so prices may not be accurate and may differ from the actual price at any given market, meaning prices are indicative and not appropriate for trading purposes. Fusion Media and any provider of the data contained in this website will not accept liability for any loss or damage as a result of your trading, or your reliance on the information contained within this website.
It is prohibited to use, store, reproduce, display, modify, transmit or distribute the data contained in this website without the explicit prior written permission of Fusion Media and/or the data provider. All intellectual property rights are reserved by the providers and/or the exchange providing the data contained in this website.
Fusion Media may be compensated by the advertisers that appear on the website, based on your interaction with the advertisements or advertisers.
© 2007-2024 - Fusion Media Limited. All Rights Reserved.