Get 40% Off
💰 Ray Dalio just increased his holdings in Google by 162.61% - See the full portfolio with InvestingPro’s free Stock Ideas toolCopy Portfolios

USD/JPY Moving Sideways Within Trading Range

Published 11/30/2015, 12:58 AM
Updated 07/09/2023, 06:31 AM
USD/JPY
-

USD/JPY 4-Hour Chart

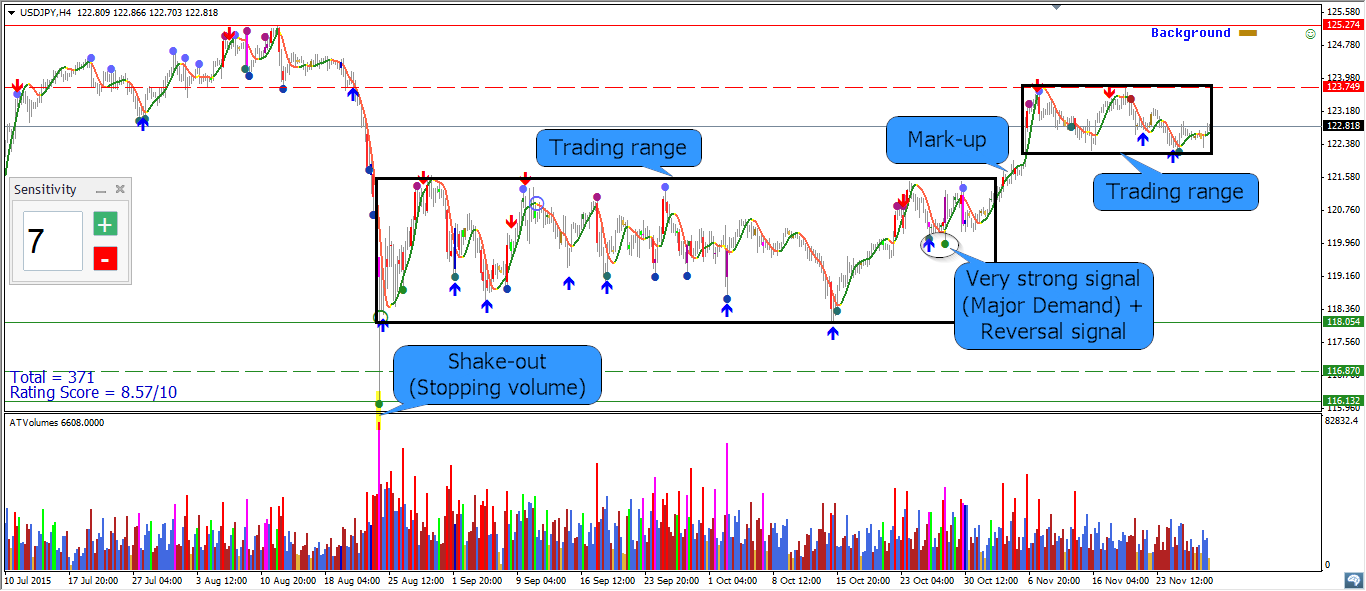
In USD/JPY analysis at first I would like to discuss H4 timeframe. After the shake-out which was also a stopping volume for mark-down movement, the price started to move sideways within trading range. This was a wide trading range. Therefore trading strategy was to wait price reversal near the resistance/support of the trading range and open a trade after the necessary signals from VSA setup. With VSA and Reversal indicators it is very easy to find a good entry and exit place. This pattern has been valid for 2.5 months until we had very strong signal (Major Demand) + Reversal signal. As a result there was a break-out from this trading range.
USD/JPY 15-Minute Chart

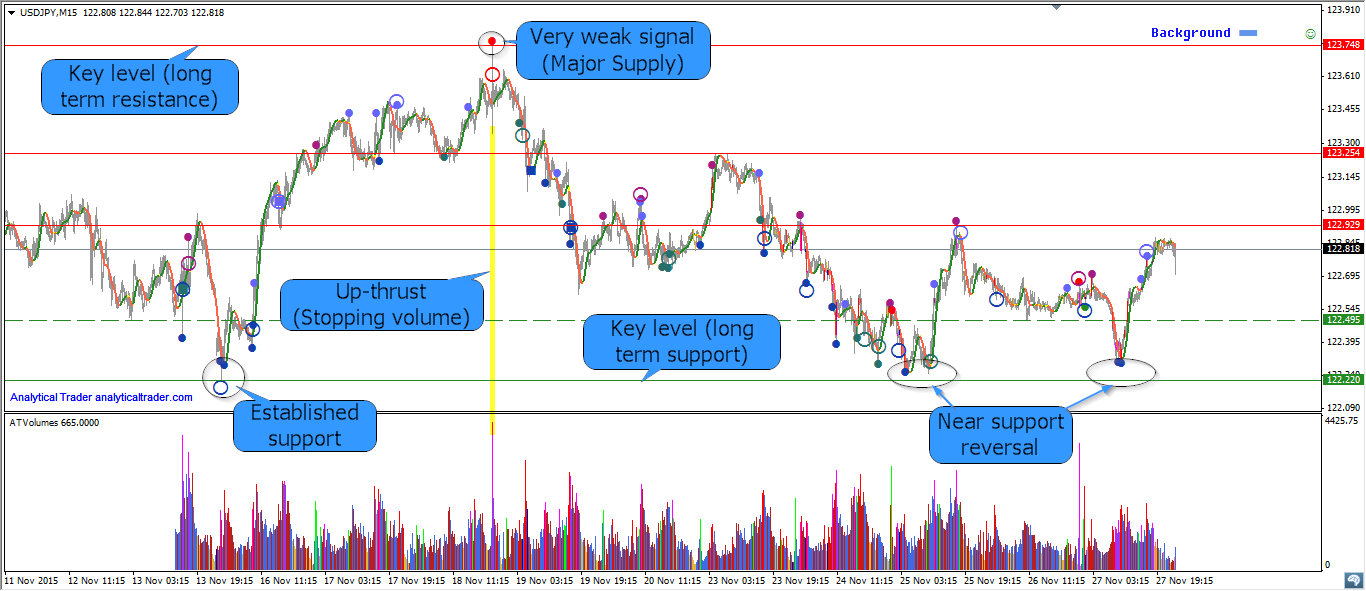
More recent picture we can see in M15 timeframe. Now the price has drawn two key levels:

  • Long term support – on the above picture you can see how this support was established after several strong signals detected by VSA indicator. What is more important – the support has already shown itself twice when the price turned direction near this line (every time we had strong signals before price reversal).
  • Long term resistance – this is the level which has also shown itself. Very remarkable setup here – up-thrust, which was also a stopping volume for mark-up movement. The up-thrust is a wide spread up-bar on very high volume which closed on the lows. The high of this bar is slightly higher than previous top (not shown in this picture). Weak Holders went long in this point and smart money used this liquidity to open short positions. VSA indicator also detected a very weak signal (Major Supply) on this bar.
3rd party Ad. Not an offer or recommendation by Investing.com. See disclosure here or remove ads .

Look carefully when the price is approaching these levels. VSA and Reversal indicators will help you to understand next price movement.

Original post

Latest comments

Risk Disclosure: Trading in financial instruments and/or cryptocurrencies involves high risks including the risk of losing some, or all, of your investment amount, and may not be suitable for all investors. Prices of cryptocurrencies are extremely volatile and may be affected by external factors such as financial, regulatory or political events. Trading on margin increases the financial risks.
Before deciding to trade in financial instrument or cryptocurrencies you should be fully informed of the risks and costs associated with trading the financial markets, carefully consider your investment objectives, level of experience, and risk appetite, and seek professional advice where needed.
Fusion Media would like to remind you that the data contained in this website is not necessarily real-time nor accurate. The data and prices on the website are not necessarily provided by any market or exchange, but may be provided by market makers, and so prices may not be accurate and may differ from the actual price at any given market, meaning prices are indicative and not appropriate for trading purposes. Fusion Media and any provider of the data contained in this website will not accept liability for any loss or damage as a result of your trading, or your reliance on the information contained within this website.
It is prohibited to use, store, reproduce, display, modify, transmit or distribute the data contained in this website without the explicit prior written permission of Fusion Media and/or the data provider. All intellectual property rights are reserved by the providers and/or the exchange providing the data contained in this website.
Fusion Media may be compensated by the advertisers that appear on the website, based on your interaction with the advertisements or advertisers.
© 2007-2024 - Fusion Media Limited. All Rights Reserved.