Many years from now, the people of Japan will tell their children and grandchildren of a time long since past when interest rates were negative and you actually had to pay the bank to give them money. The kids will go “Wow” in amazement and disbelief.
The Bank of Japan announced this exact thing the past week and this is the present we currently live in and is likely to be the case for the foreseeable future. This should see the USD/JPY now trade higher.
Let’s analyse the daily chart and then look at the quarterly chart to get an idea of when this crazy period might conclude.

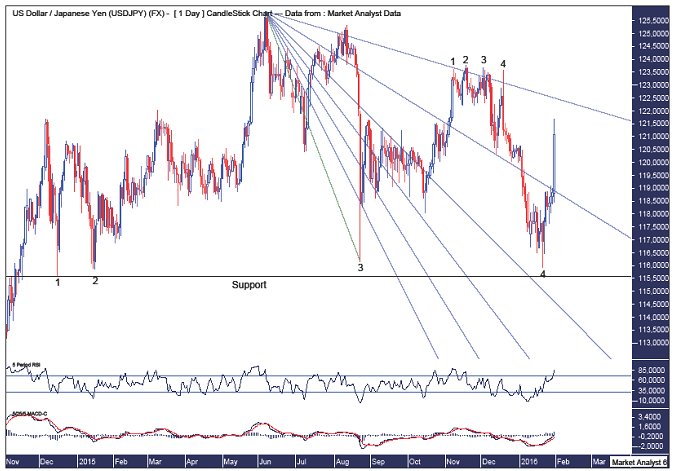
Previous analysis outlined a bearish quadruple top and this did indeed see price move down strongly. The move was stopped at strong support and set up an even more bullish quadruple bottom as this bottom has taken much more time to form. This should see a much more explosive move higher and the BOJ announcement has just confirmed this.
The horizontal line denotes support from the first low in the quadruple bottom and stands at 115.56. I doubt we will see price trade below that level for quite some time now.
The Fibonacci Fan shows price busting below the 76.4% angle after the quadruple top and price has now busted back above with the 88.6% angle the next resistance.
Price cracking above the quadruple top level at 123.75 will give much confidence that the long side is the place to be.
The RSI is in overbought territory and I expect some short term consolidation to occur in the very near future.
The MACD indicator is bullish.
Let’s now turn to the quarterly chart and see just where price may be headed over the next year or so.

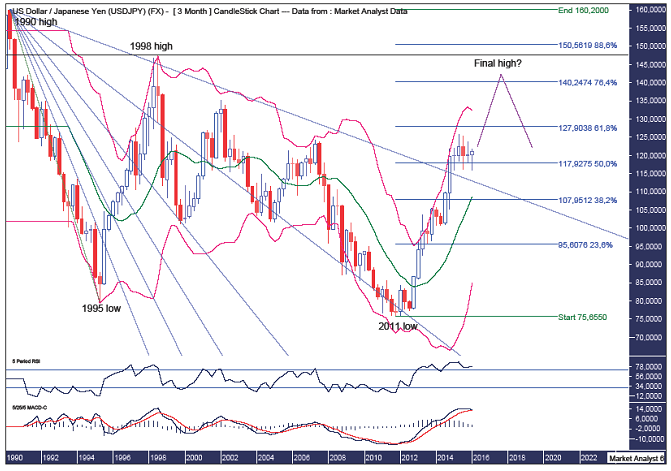
I have drawn a Fibonacci Fan from the 1990 high to 1995 low which has shown some very nice symmetry with price. The 1995 high was at resistance from the 88.6% angle and the subsequent move down found support at the 61.8% angle. Price then traded down into a low in 2011 which was at support from the 76.4% angle.
Since the 2011 low, price has exploded higher and recent busted above the 88.6% angle which was a bullish sign. There has been some consolidation and I though price may even get back down to test support from the 88.6% angle but that looks to be it and it appears price is now headed higher.
The Bollinger Bands® show price has left the upper band but doesn’t look to be threatening the middle band. On the contrary, I now expect price to surge higher back up to the upper band and extend higher.
I have added Fibonacci retracement levels of the move down from the 1990 high to 2011 low. I favour price testing the 76.4% level at 140.24 and perhaps a touch higher as it tests the 1998 high which stands at 147.62 and is denoted by the horizontal line. Price turning back down there would set up a massively bearish double top.
The RSI recently made a new high and I would like to see a bearish divergence form at the final high.
The MACD indicator shows the averages coming back together but it remains bullish and I expect it to inch higher in bullish formation for several more quarters yet.
Summing up, the pullback in the USD/JPY now appears over with the bull trend back in play.
Disclaimer: The above is a matter of opinion provided for general information purposes only and is not intended as investment advice. Information and analysis above are derived from sources and utilising methods believed to be reliable, but we cannot accept responsibility for any losses you may incur as a result of this analysis. Individuals should consult with their personal financial advisors. Put simply, it is JUST MY OPINION.
