Talking Points:
- Initial Long Entry That Just Missed
- Consolidation Presents a Second Chance
- Step-by-Step Parameters for Taking This Trade
Last week, we presented a trade idea to buy USDSGD before the Federal Open Market Committee (FOMC) policy decision. This trade was built on the premise that the currency pair was due for a sharp upswing post-FOMC. At the time, USDSGD was trading in the mid- to high-1.25 zone, and we projected a move to the high 1.26s or low 1.27s.
While the trade idea was stopped out by just a few pips, we did see USDSGD rise sharply to the high 1.26s. This move higher was in line with our pre-FOMC Elliott Wave analysis. Since then, it has shown significant sideways price action, and while USDSGD has been resting, it now provides another opportunity to buy the pair.
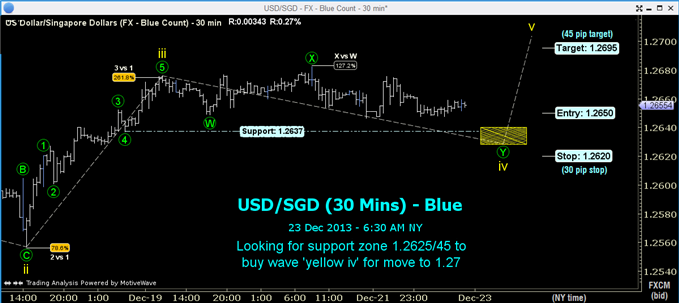
The below 30-minute USDSGD chart shows an updated Elliott Wave impulsive count from December 18. It starts with a sharp rise of over 100 pips to yellow wave iii at 1.2675, which is in line with our previous analysis. Since then, it has been in a prolonged sideways correction, ranging only 37 pips from 1.2646-1.2683.
 USD/SGD" title="USD/SGD" height="303" align="bottom" border="0" width="679">
We expect that this price action is part of the yellow wave iv correction, which is an expanded flat. Typically, we’d expect this type of expanded flat to find support between 1.2625 and 1.2645.
Therefore, we’d look to buy USDSGD just above this zone at 1.2650. This presumes a spread of between five and eight pips. We also use this zone to locate the stop just below the bottom of the zone at 1.2620. This is a reasonably tight 30-pip stop.
To make the trade worthwhile from a risk/reward perspective, we’d need to achieve a target of at least 45 pips (reward/risk of 1.5), so a single take-profit position would be 1.2695. This means we are risking $1 to make $1.50.
Based on the price levels achieved by the previous three yellow waves, a target of 1.27 is feasible. In our previous article, based on a higher degree, we discussed take-profit locations of 1.2640 and 1.2690, with likely upside to 1.2725. As a result, a target of 1.2695 is reasonable on this trade and consistent with our previous analysis.
Given the tight stop, there is one crucial aspect of trade management to discuss. If price is close to entry, but key US or Singaporean news is due, remove the orders for at least 30 minutes until price action returns to normal. If a news item has forced price below the 1.2620 stop level, abandon this trade idea altogether.
Revised Short Set-up for USD/JPY
- Trade: Buy USDSGD at 1.2650, or between 1.2630 and 1.2650
- Stop Loss: Place stop at 1.2620, below yellow wave iv
- Take Profit: A single take-profit position can be placed at 1.2695
- Trade Management: Remove orders if price is near entry and key US or Singaporean news is about to be released
By Todd Gordon, founder, TradingAnalysis.com
