Talking Points
Foreign Exchange Price & Time at a Glance:

Charts Created using Marketscope – Prepared by Kristian Kerr
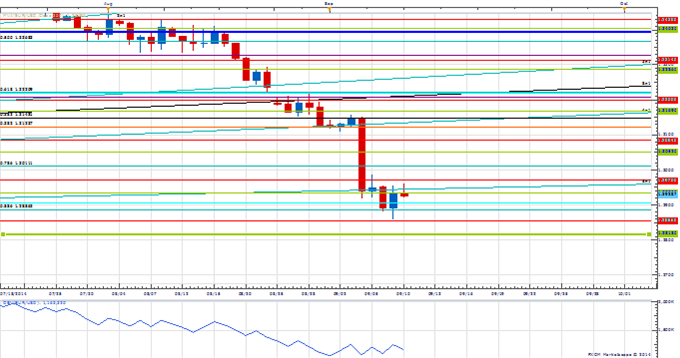
- EUR/USD touched its lowest level in over a year yesterday before rebounding off the 1st square root relationship of the 2013 low near 1.2860
- Our near-term trend bias remains lower in the rate while below 1.3010
- A close under 1.2860 is needed to kick off a new leg lower
- An important turn window is eyed later in the month
- A close below over 1.3010 would turn us positive on the euro
EUR/USD Strategy: Like holding reduced short positions while below 1.3010.
|
Instrument |
Support 2 |
Support 1 |
Spot |
Resistance 1 |
Resistance 2 |
|
1.2815 |
*1.2960 |
1.2930 |
1.2970 |
*1.3010 |

Charts Created using Marketscope – Prepared by Kristian Kerr
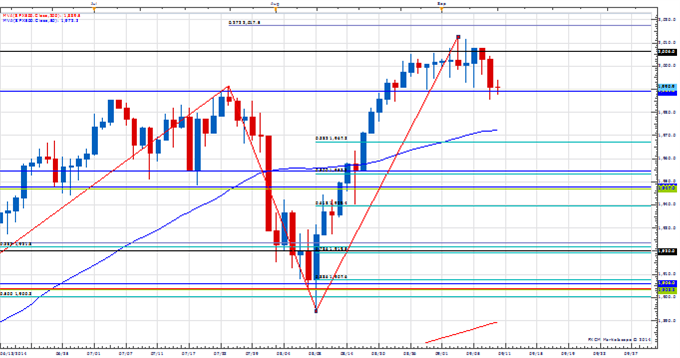
- S&P 500 failed last week near a key Gann level related to the 2009 low
- Our near-term trend bias is lower while below 2012
- A close below 1990 is needed confirm that some sort of top is in place
- A cycle turn window is eyed later this month
- A move over 2012 will turn us positive on the market again
S&P 500 Strategy: Like being short against 2012.
|
Instrument |
Support 2 |
Support 1 |
Spot |
Resistance 1 |
Resistance 2 |
|
S&P 500 |
1970 |
*1990 |
1990 |
1996 |
*2012 |
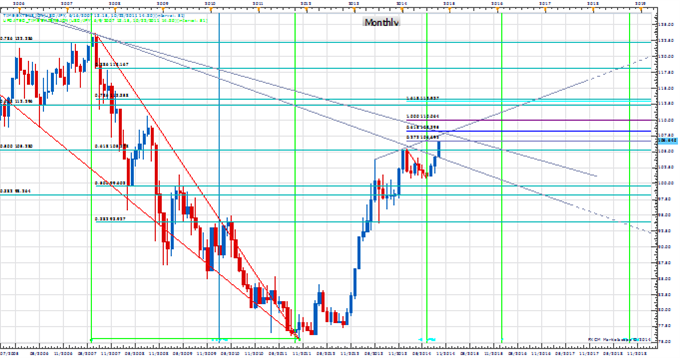
Focus Chart of the Day: USD/JPY

With USD/JPY breaking out to new 6-year highs over the past couple of days I thought it would be useful to revisit the monthly chart as it has been a good big picture guide. At the start of the year USD/JPY failed right around 105.30 which was the convergence of the 61.8% retracement of the 2002-2011 decline and the 50% retracement of the 2002-2011 decline. The recent break above this long-term resistance zone is obviously potentially very bullish - especially if the exchange rate can hold above 105.30 into the end of the month as this would favor a move towards the next long-term Fibonacci resistance cluster around 112.30/113.35. A convergence of the trendline connecting the 2002 & 2007 peaks and the 1.618% extension of the 1Q14 range around 1.0800/30 could prove sticky in the near-term, but the real zone of attraction in the way I look at things appears to be closer to 112.00. Failure to achieve a monthly close over 105.30 would make me doubt the validity of the break out, but weakness under the trendline connecting the 1998 & 2007 highs near 104.00 is needed to turn the picture more overtly negative.
--- Written by Kristian Kerr, Senior Currency Strategist for DailyFX.com
