Despite breaking a series of significant supports last week, price has since pullback significantly, trading above the 96.7 March high last Friday. On hindsight this is not exactly unexpected as price has managed to shave off more than 400 pips from peak to trough from Thursday – Friday, a significant move considering that 5 day ATR is only 1 big figure a day, itself a significant increase from pre Abenomics days when it is considered volatile when price move more than 50 pips a day.
Daily Chart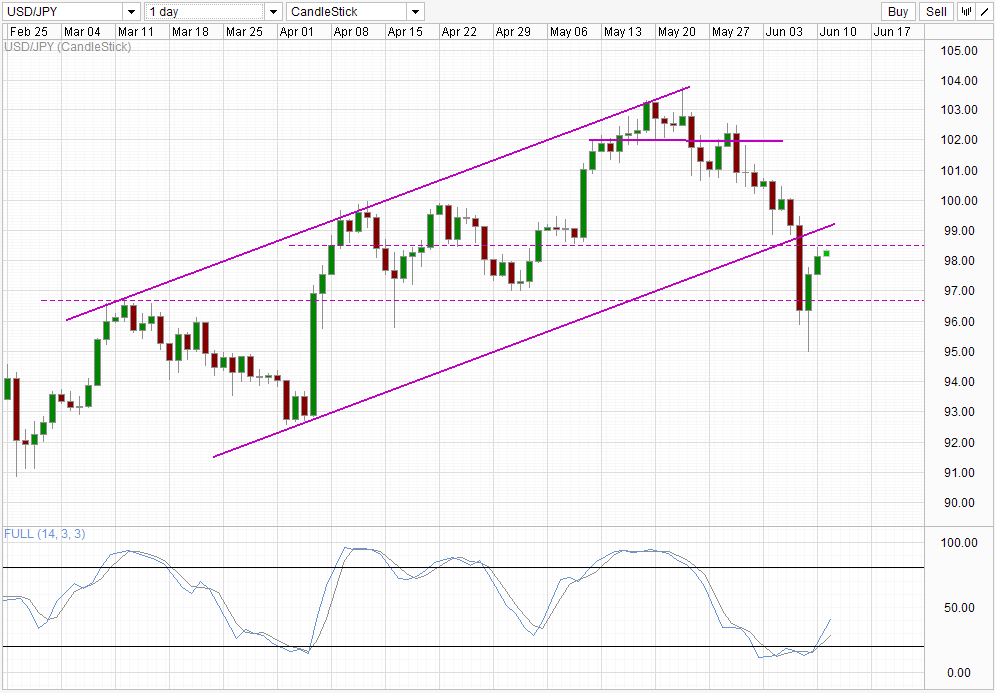 USD/JPY 1" width="580" height="403">
From a technical perspective, the corrective pullback affirms the trading range 96.7 – 100.0, which covers most part of April’s trading. Currently price is looking to test 98.5 interim peaks, but essentially 98.5 – 100.0 can be considered a resistance zone which will help bears to rebuff price from attempting to climb back into the Rising Channel. Should price trade back lower after entering the aforementioned resistance zone, this can be regarded as a confirmation for the breakout of the Rising Channel, giving bears a potential accelerating push to seek lower grounds closer to 90.0, where Feb/March lows are found.
Stochastic readings suggest that a recovery move higher from here is possible, but that still fit comfortably with the scenario where the top end of resistance is closer to 100.0. Looking at historical Stoch readings, it is also possible where readings may form an interim peak below 50.0, where Stoch formed interim peaks and troughs back in 1st Mar, 28th Mar, and most recently 4th May.
Hourly Chart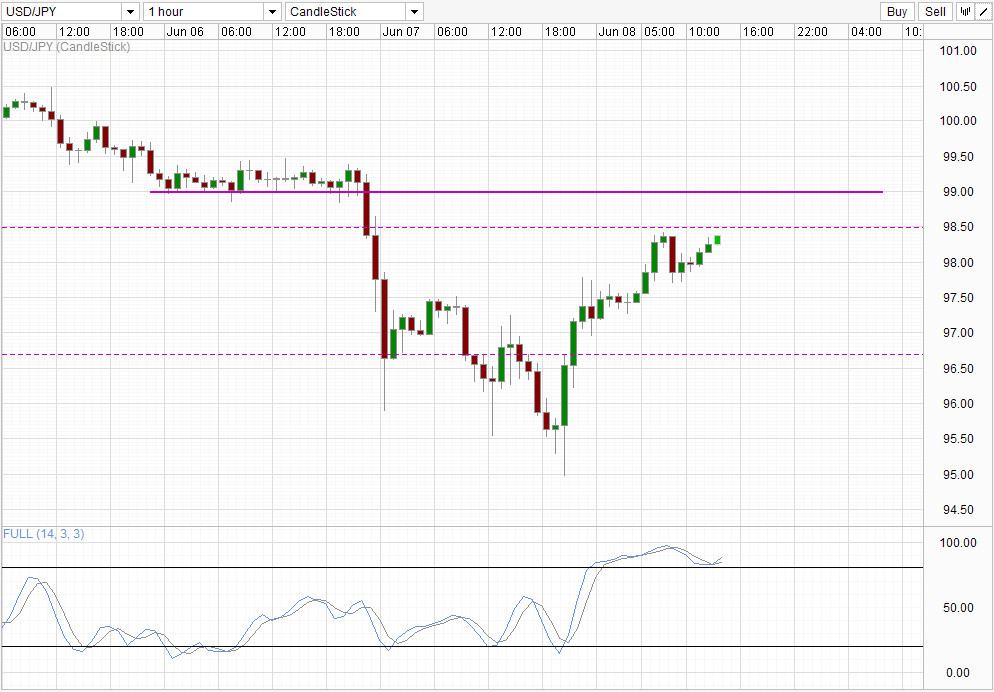 USD/JPY 2" width="580" height="403">
From the shorter-term chart, price may face an additional level of resistance between 99.0 – 99.5 on top of the broader 98.5 – 100.0 band. Looking at Stochastic readings of the short-term chart, it seems likely that price may bounce lower with readings highly overbought already. That being said, the readings appear to be forming an interim trough above the 80.0 mark, which suggest that price may still yet be able to move higher, but perhaps not much further considering the degree of Overbought that we are in. This again sits in nicely with the 98.5 – 100.0 broader resistance band scenario described above, forming a coherent narrative between Daily and Hourly chart.
Fundamentally, it is important to note that Japan’s economy is still not picking up as much as we wanted. Granted Q1 GDP has now been proven to be slightly better than expected, but inflation figures remain under expectations, putting in doubt the true effectiveness of “Abenomics”, which is the main driver of current JPY weakness. With BOJ decision coming up tomorrow, Kuroda and his fellow BOJ members will need to do something big in order to spur USD/JPY and Nikkei higher once more. Do it right, and we could see a rally ala – 5th April. If not, technicals bears will be likely to see their confirmation for the bearish breakout which will send price moving lower for the rest of June.
Original post
- English (UK)
- English (India)
- English (Canada)
- English (Australia)
- English (South Africa)
- English (Philippines)
- English (Nigeria)
- Deutsch
- Español (España)
- Español (México)
- Français
- Italiano
- Nederlands
- Português (Portugal)
- Polski
- Português (Brasil)
- Русский
- Türkçe
- العربية
- Ελληνικά
- Svenska
- Suomi
- עברית
- 日本語
- 한국어
- 简体中文
- 繁體中文
- Bahasa Indonesia
- Bahasa Melayu
- ไทย
- Tiếng Việt
- हिंदी
USD/JPY: Technical Rebound Facing Resistance Between 98.5
Published 06/10/2013, 07:34 AM
Updated 07/09/2023, 06:31 AM
USD/JPY: Technical Rebound Facing Resistance Between 98.5
3rd party Ad. Not an offer or recommendation by Investing.com. See disclosure here or
remove ads
.
Latest comments
Install Our App
Risk Disclosure: Trading in financial instruments and/or cryptocurrencies involves high risks including the risk of losing some, or all, of your investment amount, and may not be suitable for all investors. Prices of cryptocurrencies are extremely volatile and may be affected by external factors such as financial, regulatory or political events. Trading on margin increases the financial risks.
Before deciding to trade in financial instrument or cryptocurrencies you should be fully informed of the risks and costs associated with trading the financial markets, carefully consider your investment objectives, level of experience, and risk appetite, and seek professional advice where needed.
Fusion Media would like to remind you that the data contained in this website is not necessarily real-time nor accurate. The data and prices on the website are not necessarily provided by any market or exchange, but may be provided by market makers, and so prices may not be accurate and may differ from the actual price at any given market, meaning prices are indicative and not appropriate for trading purposes. Fusion Media and any provider of the data contained in this website will not accept liability for any loss or damage as a result of your trading, or your reliance on the information contained within this website.
It is prohibited to use, store, reproduce, display, modify, transmit or distribute the data contained in this website without the explicit prior written permission of Fusion Media and/or the data provider. All intellectual property rights are reserved by the providers and/or the exchange providing the data contained in this website.
Fusion Media may be compensated by the advertisers that appear on the website, based on your interaction with the advertisements or advertisers.
© 2007-2024 - Fusion Media Limited. All Rights Reserved.