
The first formal task as chair of the Federal Reserve commences on Tuesday, as Dr. Yellen takes on the challenge with her first debut speech on the same day. Five years went by, with easy flow of stimulus under Bernanke’s ruling, but now a drastic change of policies is underway. So, the question remians, will this new turn of play be as radical for the US economy as some are expecting? A,nd not only for the week ahead, but for the whole of 2014?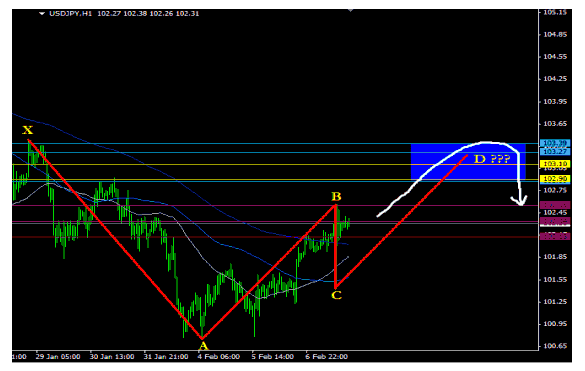 USD/JPY Hourly Chart" title="USD/JPY Hourly Chart" width="464" height="277">
As most concerns about the cutting back on stimulus and bond purchases be aired and dealt with on Tuesday, the next day will see to another announcement by UK’s central bank, the BOE. This said, news and updates from both Yellen of the Feds and Carney of the BOE needs to be given much importance by traders and investors as these are events that may move markets this week.
Let us take a look at the USD/JPY Hour Chart. As clearly illustrated above, a ‘W’ pattern seems to be forming with prices possibly progressing upwards form C to D and a fall in prices is expected once the pattern has completed within the Price reversal Zone (PRZ) marked by the blue box as probable D point. The dollar seemed to have been trading above all three Moving Averages ( 50, 100, 200). Additionally, due to a strong positive correlation of the dollar to both the EUR/JPY and the GBP/JPY and with bullish sentiments dominating the two pairs, the USD/JPY is expected to follow suite. The USD/JPY closed at 102.31 as of Friday and ideal entry for buyers would be preferred to be a conservative one at above the 103.50 level ideally at either 103.55 or 103.60 with profit taking levels being anywhere within the blue box which marks the PRZ zone at D point.
Once the W pattern is said to have completed within the PRZ area, sellers may dominate by driving prices lower from the ideal sell entry prices at 103.10 towards the horizontal purple lines between 102.55 to 102.13 as your possible take profit (TP) area.
- English (UK)
- English (India)
- English (Canada)
- English (Australia)
- English (South Africa)
- English (Philippines)
- English (Nigeria)
- Deutsch
- Español (España)
- Español (México)
- Français
- Italiano
- Nederlands
- Português (Portugal)
- Polski
- Português (Brasil)
- Русский
- Türkçe
- العربية
- Ελληνικά
- Svenska
- Suomi
- עברית
- 日本語
- 한국어
- 简体中文
- 繁體中文
- Bahasa Indonesia
- Bahasa Melayu
- ไทย
- Tiếng Việt
- हिंदी
USD/JPY: Buyers Should Enter Conservatively, Above 103.50 Level
Published 02/10/2014, 04:19 AM
Updated 07/09/2023, 06:32 AM
USD/JPY: Buyers Should Enter Conservatively, Above 103.50 Level
3rd party Ad. Not an offer or recommendation by Investing.com. See disclosure here or
remove ads
.
Latest comments
Install Our App
Risk Disclosure: Trading in financial instruments and/or cryptocurrencies involves high risks including the risk of losing some, or all, of your investment amount, and may not be suitable for all investors. Prices of cryptocurrencies are extremely volatile and may be affected by external factors such as financial, regulatory or political events. Trading on margin increases the financial risks.
Before deciding to trade in financial instrument or cryptocurrencies you should be fully informed of the risks and costs associated with trading the financial markets, carefully consider your investment objectives, level of experience, and risk appetite, and seek professional advice where needed.
Fusion Media would like to remind you that the data contained in this website is not necessarily real-time nor accurate. The data and prices on the website are not necessarily provided by any market or exchange, but may be provided by market makers, and so prices may not be accurate and may differ from the actual price at any given market, meaning prices are indicative and not appropriate for trading purposes. Fusion Media and any provider of the data contained in this website will not accept liability for any loss or damage as a result of your trading, or your reliance on the information contained within this website.
It is prohibited to use, store, reproduce, display, modify, transmit or distribute the data contained in this website without the explicit prior written permission of Fusion Media and/or the data provider. All intellectual property rights are reserved by the providers and/or the exchange providing the data contained in this website.
Fusion Media may be compensated by the advertisers that appear on the website, based on your interaction with the advertisements or advertisers.
© 2007-2024 - Fusion Media Limited. All Rights Reserved.