Hourly Chart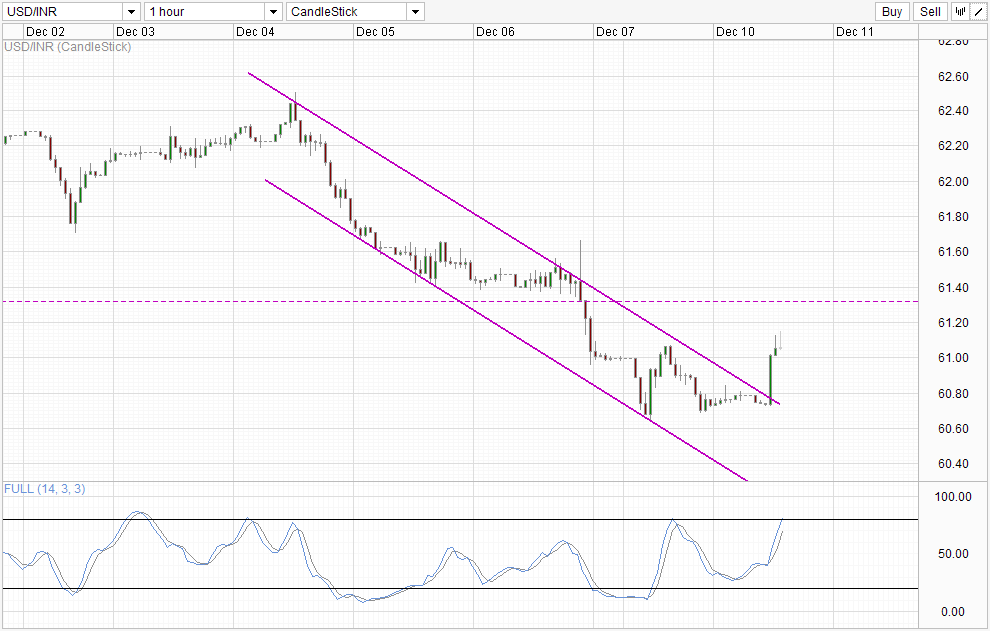 USD/INR Hourly" title="USD/INR Hourly" height="631" width="990">
USD/INR saw a sudden spike this morning, a reflection of the decline in India's main stock index Sensex. However, before Rupee bears get too carried away, it should be noted that the decline in Sensex is merely a profit taking exercise after prices have hit a record high the day before. Hence, traders hoping for a strong bullish follow-through of current Channel Breakout may be disappointed to know that reasons for further weakness in INR just isn't there.
On the USD front, price action of Gold and US Stocks showed that market may be once again getting immune from QE Tapering fears, and hence USD may not be as bullish in the short run as well even if the Fed does implement a cut in QE next week. Furthermore, the lack of Tapering Fears means that US stocks may be able to climb higher with less inhibitions, which will weaken USD as the need for safe haven will be lower. Even though long-term direction for USD/INR remains higher due to the discrepancy between US and India's economic strength, there is very little bullish ongoing in the short-term.
From a pure technical perspective, price may have pushed a fresh weekly high but bulls will need to clear 61.3 resistance and preferably above 61.4 in order to show that the bullish conviction has legs to run. However stochastic does not favor such a move with Stoch Curve already within the Overbought region, and we shouldn't be surprise if prices fail to break the 61.3 resistance or perhaps even reverse lower here .
Weekly Chart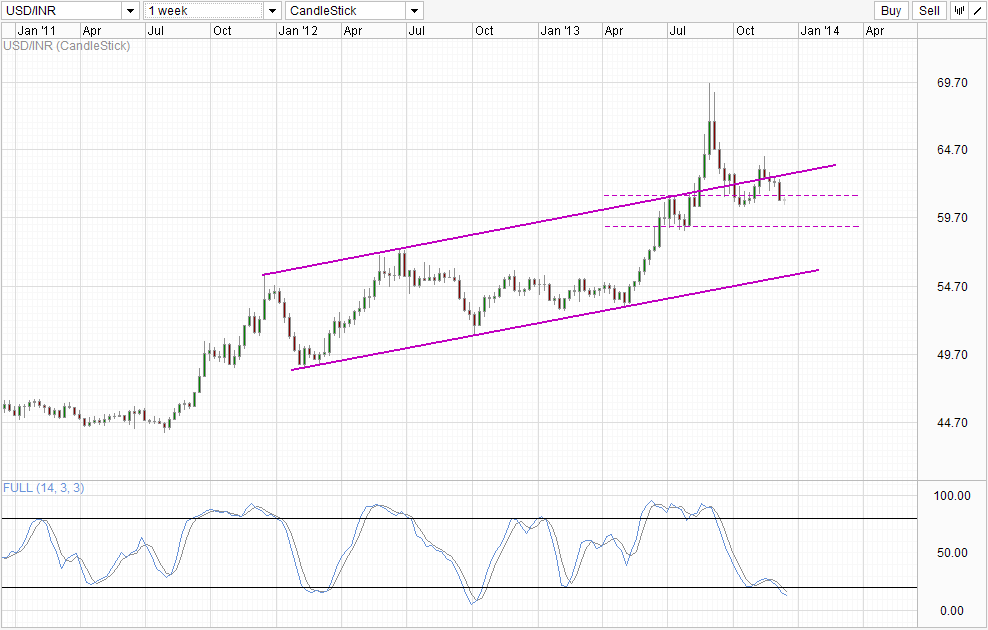 USD/INR Weekly" title="USD/INR Weekly" height="631" width="990">
Not much development from the Weekly Chart though, as price will need to hit below 60.5 and above 61.3 for stronger directional signals. Stochastic is not exactly helpful here as both Stoch/Signal lines are pointing lower despite being within the Oversold region, and considering that this is the Weekly Chart, it may take 2-3 more weeks at the minimum before a proper bullish cycle signal can emerge. Nonetheless, should prices close around current levels and close above 61.3 in the following week, the likelihood of a false break into the 59.0 - 61.3 consolidation zone increases, and the long-term uptrend will be in play which opens up Channel Top as a viable bullish target.
Original post
- English (UK)
- English (India)
- English (Canada)
- English (Australia)
- English (South Africa)
- English (Philippines)
- English (Nigeria)
- Deutsch
- Español (España)
- Español (México)
- Français
- Italiano
- Nederlands
- Português (Portugal)
- Polski
- Português (Brasil)
- Русский
- Türkçe
- العربية
- Ελληνικά
- Svenska
- Suomi
- עברית
- 日本語
- 한국어
- 简体中文
- 繁體中文
- Bahasa Indonesia
- Bahasa Melayu
- ไทย
- Tiếng Việt
- हिंदी
USD/INR: Short Term Bullish Breakout
Published 12/10/2013, 02:40 AM
Updated 07/09/2023, 06:31 AM
USD/INR: Short Term Bullish Breakout
Latest comments
Loading next article…
Install Our App
Risk Disclosure: Trading in financial instruments and/or cryptocurrencies involves high risks including the risk of losing some, or all, of your investment amount, and may not be suitable for all investors. Prices of cryptocurrencies are extremely volatile and may be affected by external factors such as financial, regulatory or political events. Trading on margin increases the financial risks.
Before deciding to trade in financial instrument or cryptocurrencies you should be fully informed of the risks and costs associated with trading the financial markets, carefully consider your investment objectives, level of experience, and risk appetite, and seek professional advice where needed.
Fusion Media would like to remind you that the data contained in this website is not necessarily real-time nor accurate. The data and prices on the website are not necessarily provided by any market or exchange, but may be provided by market makers, and so prices may not be accurate and may differ from the actual price at any given market, meaning prices are indicative and not appropriate for trading purposes. Fusion Media and any provider of the data contained in this website will not accept liability for any loss or damage as a result of your trading, or your reliance on the information contained within this website.
It is prohibited to use, store, reproduce, display, modify, transmit or distribute the data contained in this website without the explicit prior written permission of Fusion Media and/or the data provider. All intellectual property rights are reserved by the providers and/or the exchange providing the data contained in this website.
Fusion Media may be compensated by the advertisers that appear on the website, based on your interaction with the advertisements or advertisers.
© 2007-2024 - Fusion Media Limited. All Rights Reserved.