The U.S. dollar plunged to a three year low on Friday as investors flocked to the euro amid rising optimism of accelerated growth. The U.S. dollar index closed last week at 90.60. The declines came following the BoJ's surprise announcement to reduce its longer dated bond purchases and the ECB's meeting minutes.
The ECB's minutes showed that officials are hopeful of the economic recovery which could warrant a change to the central bank's forward guidance.
On Friday, economic data from the U.S. showed that consumer price rose at a subdued pace. Headline inflation was seen rising 0.1% on a month over month basis, following a 0.4% increase in November. Core CPI was slightly better, rising 0.3% on the month. Retail sales were broadly in-line with estimates rising 0.4% on headline and core retail sales.
Looking ahead, the economic calendar is quiet today. The markets are likely to continue from Friday's theme. The euro currency could see some further momentum as investors shape their expectations ahead of next week's ECB meeting.
EUR/USD intra-day analysis

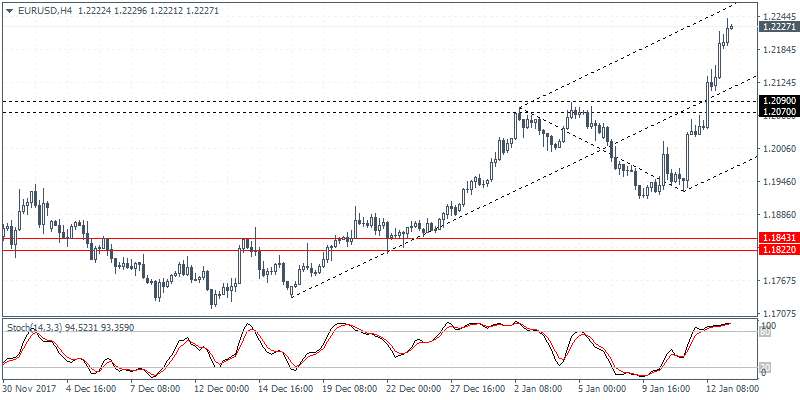
EUR/USD (1.2227): The EUR/USD rose to a 4-year high on Friday, closing at 1.2196. The gains came as price broke past the technical resistance level of 1.2090 - 1.2070. The surge was led by a strong bullish momentum in price. However, at the current levels, EUR/USD remains slightly elevated and could pose a risk of a correction. The previously established resistance level at 1.2090 - 1.2070 could remain under pressure as price could revisit this level to establish support. Renewed buying interest could be seen, but a break down below this level could send the euro falling to the 1.1900 levels in the short term.
USD/JPY intra-day analysis

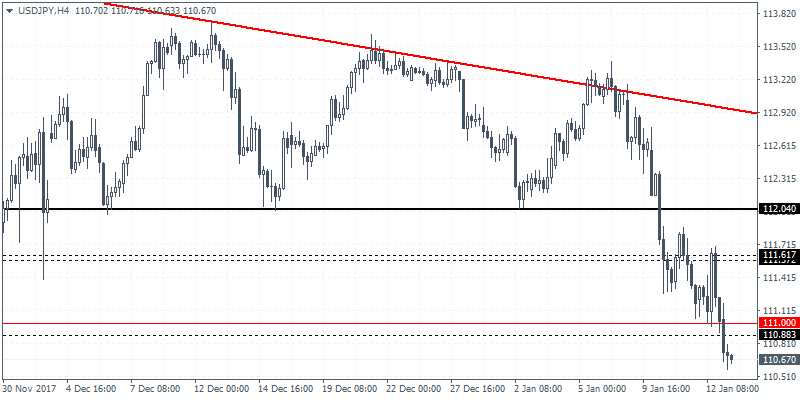
USD/JPY (110.67): The USD/JPY closed at a two month low on Friday at 111.01. The declines extended for four consecutive days following the Bank of Japan's announcement on its longer date bonds. The price action is expected to see the USD/JPY consolidate near the support zone of 111.00 - 110.88 region. We expect that price action will test this level a bit more firmly. The support level gives view to the upside as USD/JPY could remain range bound within the 111.50 region and 111.00 levels of support.
NZD/USD intra-day analysis

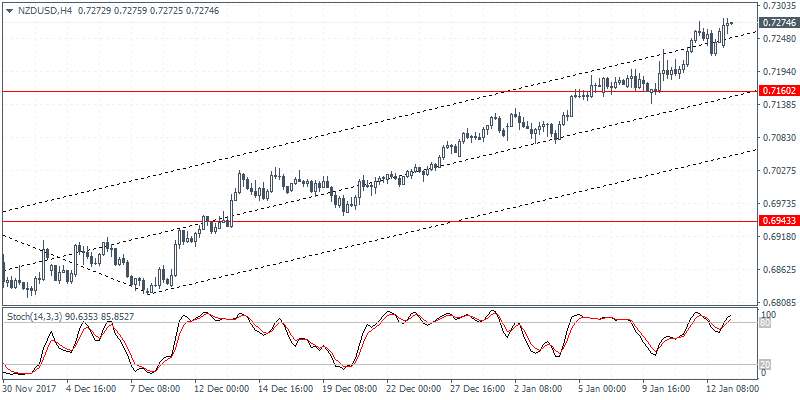
NZD/USD (0.7274): The NZD/USD maintained strong gains last week as price closed at a four month high of 0.7259. However, the doji close on Friday could indicate some profit taking resulting in a short term correction. With the daily trend line being breached, NZD/USD could revisit the breakout level around 0.7160. Establishing support at this level could validate further upside gains in the currency pair. At the same time, if NZD/USD fails to find support, we could expect to see a deeper correction that could push price down to the 0.6944 region.
