The non farm payrolls print for April is due for release this Friday 8th May with a consensus estimate of 225k increase. This follows a disappointing March result of 126k vs consensus of 244k.
Given that the non farm payrolls is one of the most watched releases by markets, we thought it may be useful to look back over recent years to see how the April print in particular has fared. Our dataset also allows some analysis of market volatility in release week and of how markets have reacted to surprises.
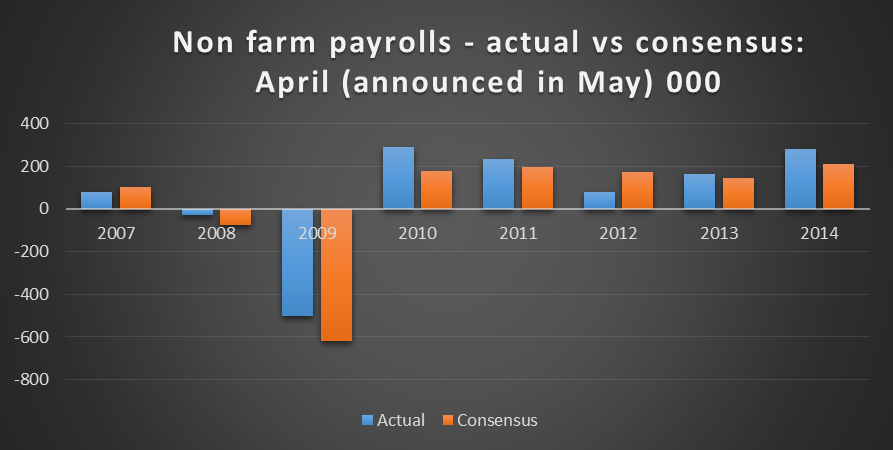
As shown in the graph below, for the eight years from 2007, the April print has exceeded consensus six times and fallen short two times with an average overshoot of 37k.

For all months from 2007, the actual has surprised on the upside 56% of months with an average undershoot of 2k – suggesting that April has been one of the better performing months relative to consensus.
Of the four Marches that underperformed consensus, three of the following Aprils outperformed consensus.
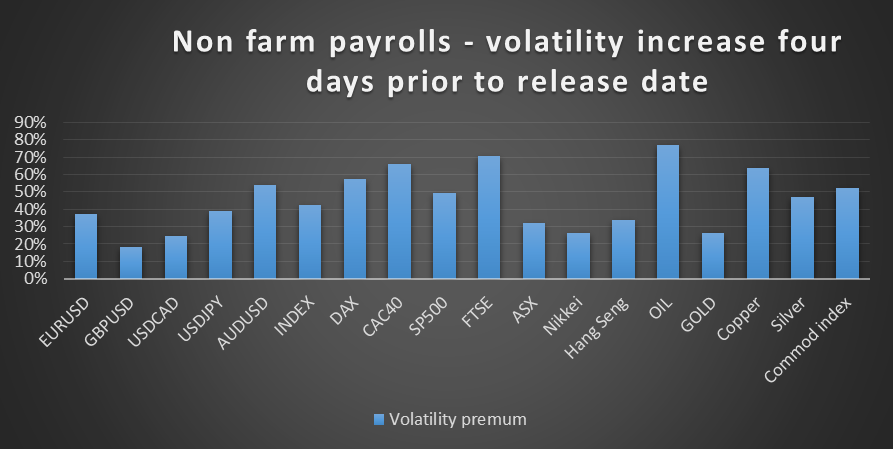
The week the non farm payrolls is released has typically shown increased volatility in most markets. The graph below shows the percentage increase in volatility over the four days prior to and including the release date, over the volatility for the 20 days leading up to that four day period –

The northern hemisphere equity markets and commodities (other than gold) stand out as being particularly volatile in the four days up to and including non farm payrolls release.
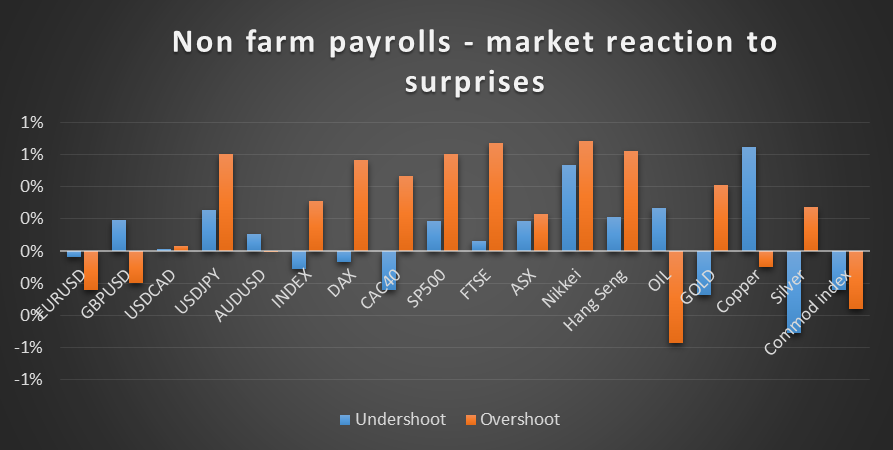
The increased volatility is a clear reflection of the sensitivity of markets to over vs undershoot of consensus, evident in the graph below.
The US dollar has tended to benefit from upside surprises in the data, which is not surprising given the increased likelihood of higher interest rates earlier, that may have been perceived to follow from a good result. Equity markets have likewise performed better when the data has overshot, suggesting that the positive implications for earnings and risk abatement appear to have outweighed the negative of higher interest rates in investors’ minds.
However, oil and copper have moved adversely when the data has overshot (probably weighing down the commodity index which also performed worse when the data overshot).

Whilst an overshoot has generally resulted in more favourablemarket movements than an undershoot (except for copper and oil), markets have not always reacted unfavourably to an undershoot. For example, USD/JPY, the S&P 500, FTSE and the Asian area equity markets have on average strengthened at times the data has surprised on the downside (although performing better when the reverse has applied).
