The Conference Board released the leading and coincident indicators, both of which provide an excellent summation of current and future activity. The LEIs increased .6% while the CEIs were up .2. Of particular interest is the LEIs composition:
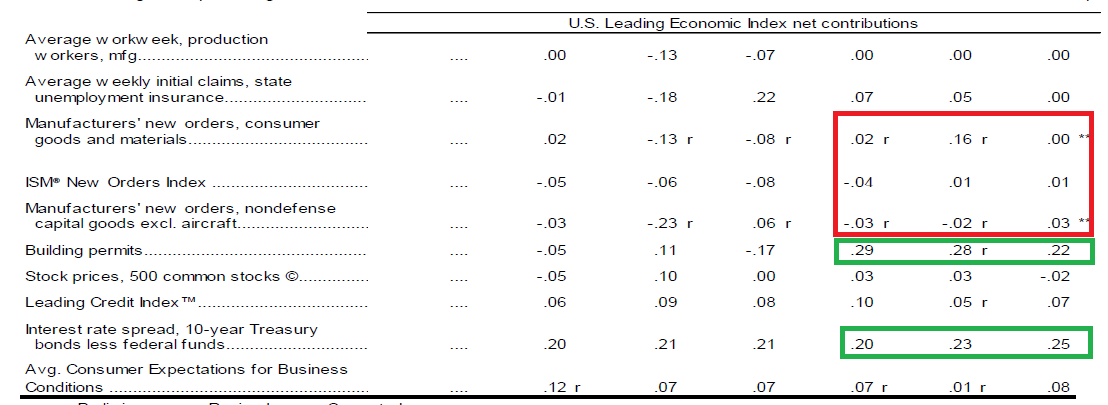
New orders are weak and have been for the last three months. This shows the negative impact of the strong dollar, weaker overseas economies and declining oil patch investment. In contrast, the housing market is the primary driver of LEI growth. Building permits only account for 3% of the LEIs, making their contribution that much more impressive. The coincident numbers stand in stark contrast:

All four components drove growth. Before moving onto the housing market, let’s look at one more important detail:
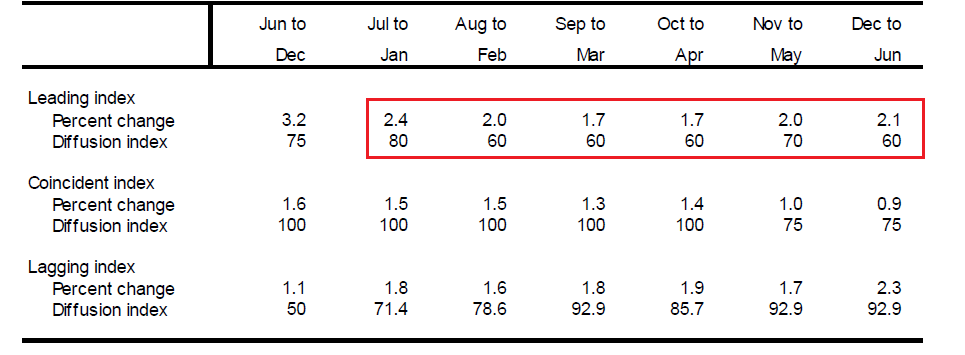
The rolling 6-month rate of change continues to decrease. It is still rising, but doing so at a lower percentage rate.
Housing market news was split. Existing home sales were strong:
Sales of previously owned U.S. homes climbed to an eight-year high in June as momentum in the residential real estate market accelerated.
The housing market has picked up in recent months as more jobs, historically low mortgage rates and greater household formation boost demand. Faster wage growth will be needed to help housing continue its recovery and become a bigger contributor to growth this year.
“The housing market is on fire,” said Thomas Costerg, a senior economist at Standard Chartered Bank in New York (LONDON:STAN), who projected sales would rise to a 5.48 million pace. “The strength in housing could offset some of the weakness we are seeing elsewhere.”
The following graph places this number in historical perspective:
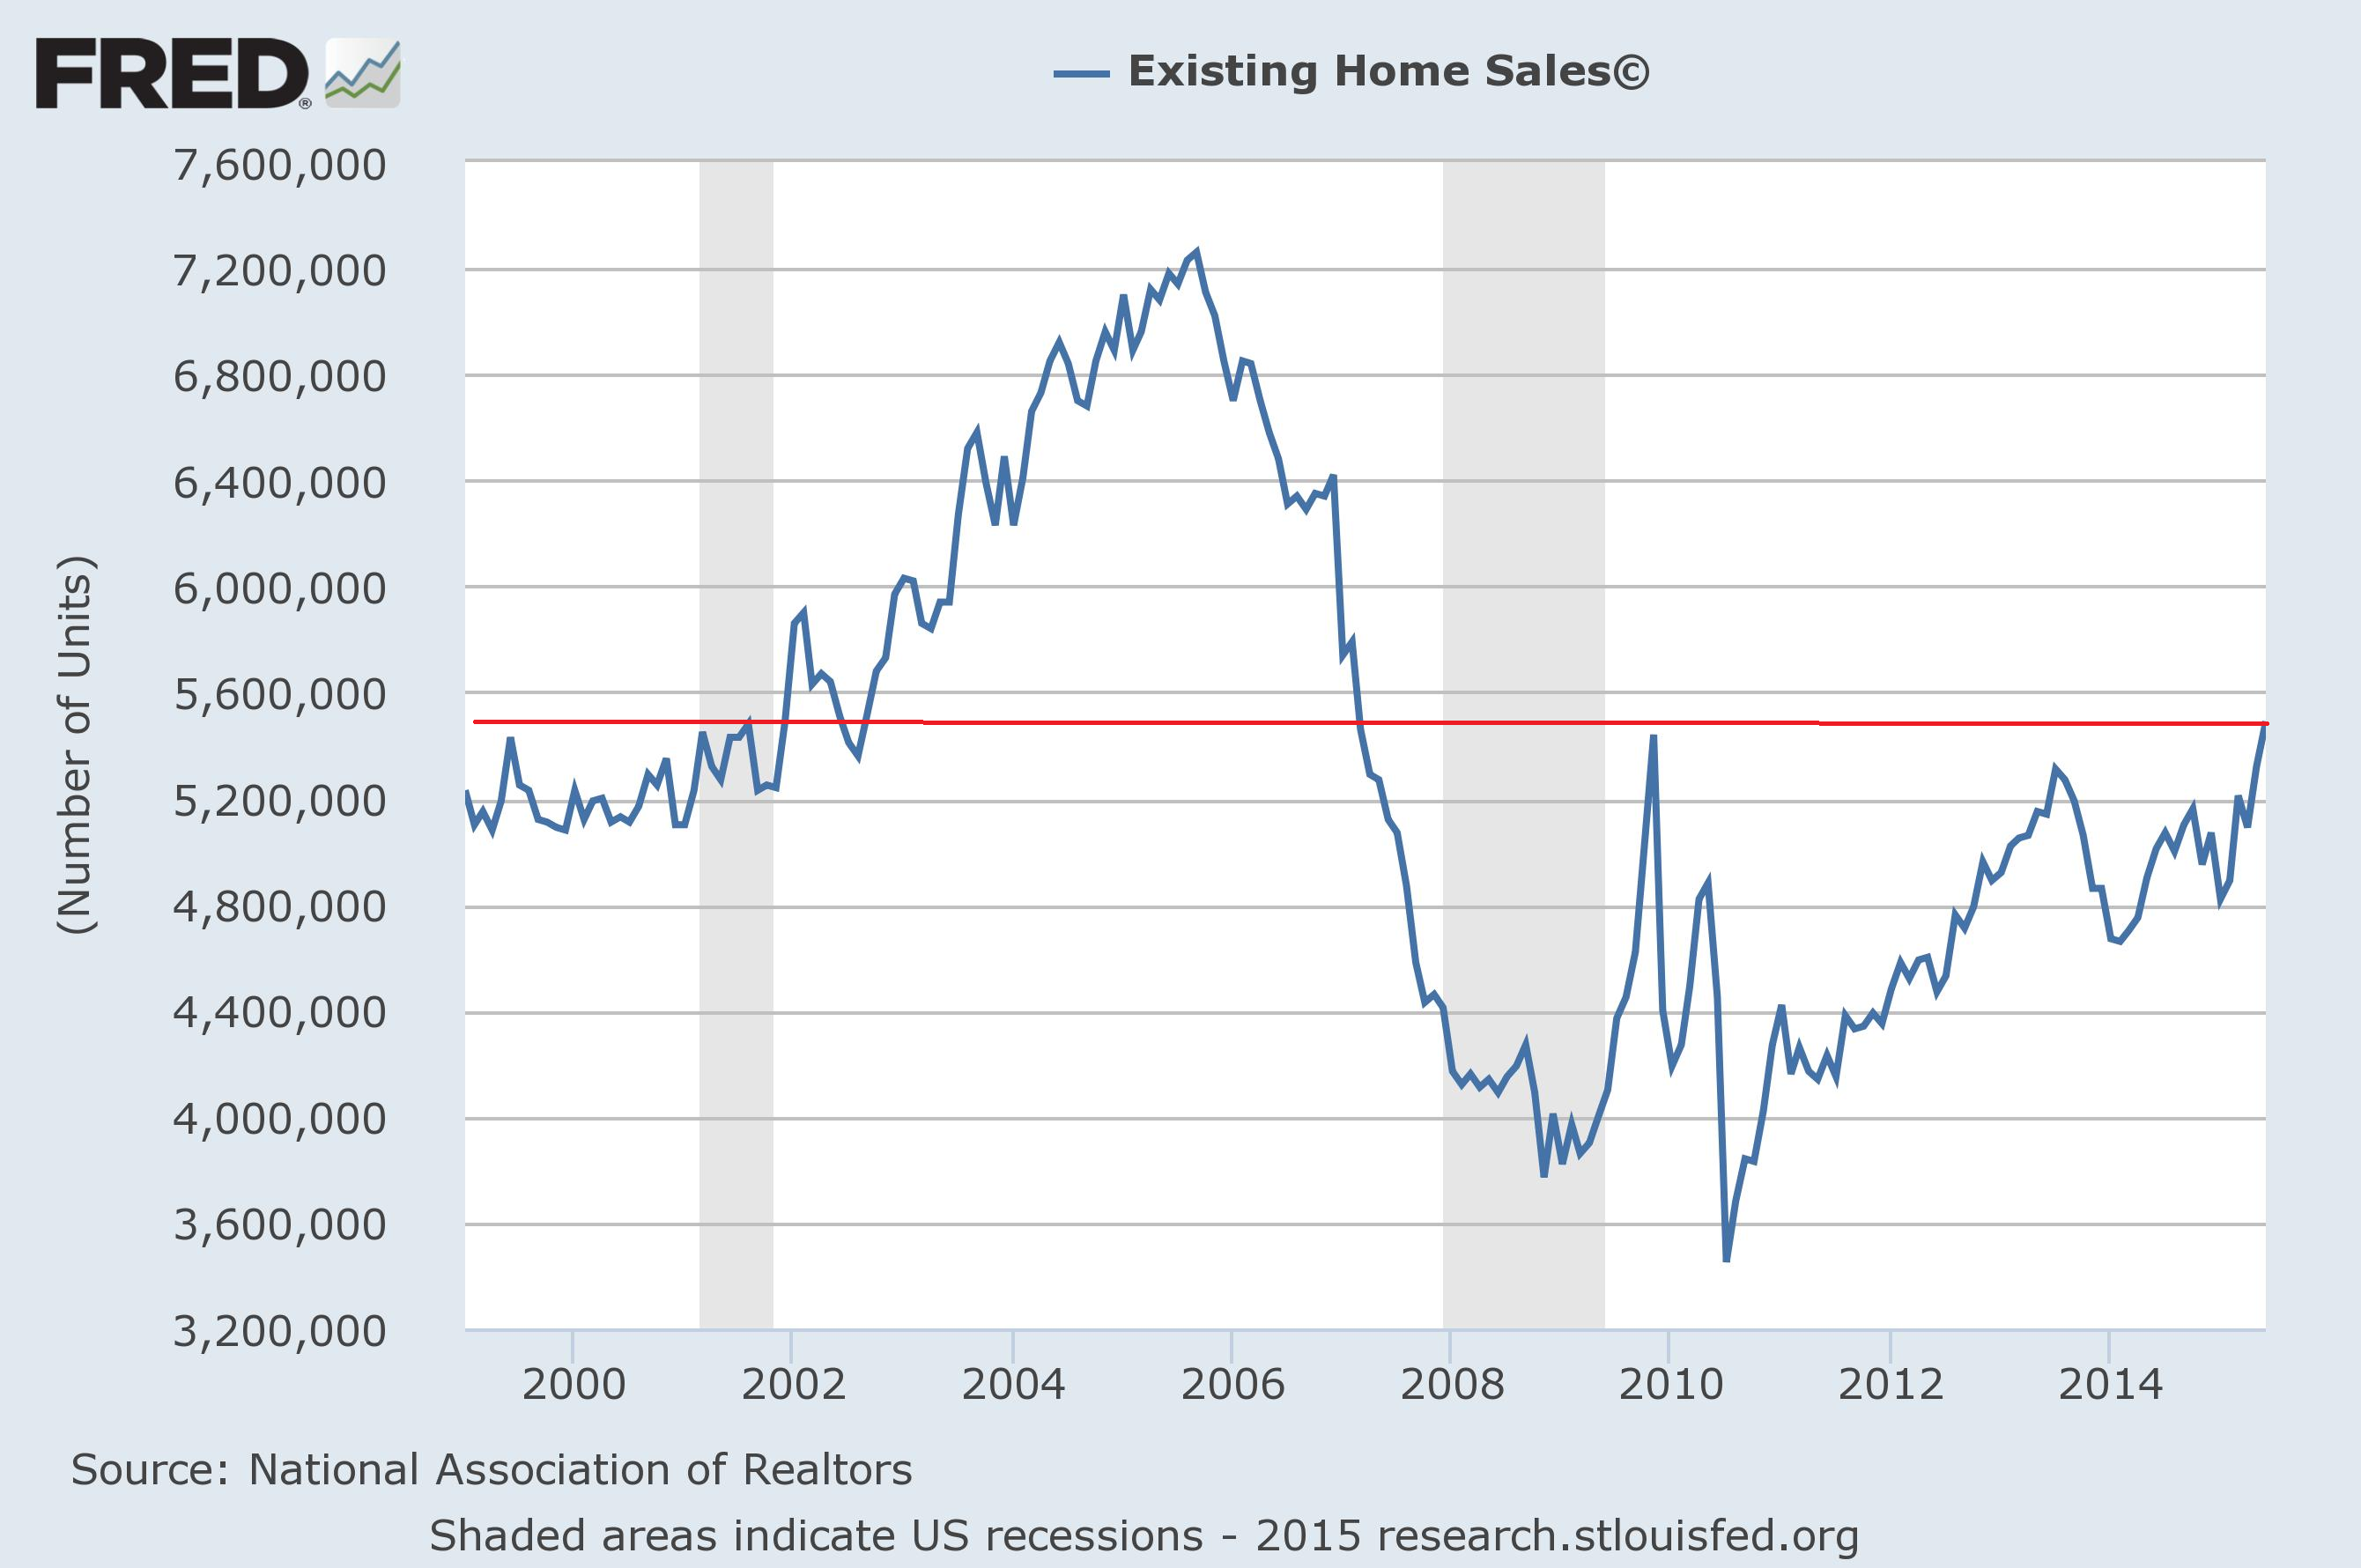
Overall sales are now at higher levels than those at the end of the 1990s boom. There is still plenty of upside room to run.
In contrast, new homes were off 6.8%. However, as Calculated Risk notes, the Y/Y rate of increase is still very strong:
The Census Bureau reported that new home sales this year, through June, were 274,000, not seasonally adjusted (NSA). That is up 21.2% from 226,000 sales during the same period of 2014 (NSA). That is a strong year-over-year gain for the first half of 2015!
And the overall trend is still higher, meaning the current reading is probably a natural pull-back from a strong increase over the preceding months.
In conclusion, this week’s numbers were positive for the US market. The LEIs and CEIs point to continued expansion. Existing home sales numbers continue to increase. And while new homes sales were disappointing, the Y/Y numbers continue to impress.
The markets are still expensive. The current and forward PE for the SPYs and QQQs are 21.18/23.15 and 17.82/18.98, respectively. Equities desperately need an increase in revenues and earnings to move higher. Regarding the current status of earnings season, Zack’s made the following observations:
As of July 24th, we have seen Q2 result from 186 S&P 500 members that combined account for 52.0% of the index’s total market capitalization. Total earnings for these companies are up +3.6% on +0.9% revenue gains, with 73.3% beating EPS estimates and 50.8% coming ahead of revenue expectations.
However, the industry scorecard is more nuanced:
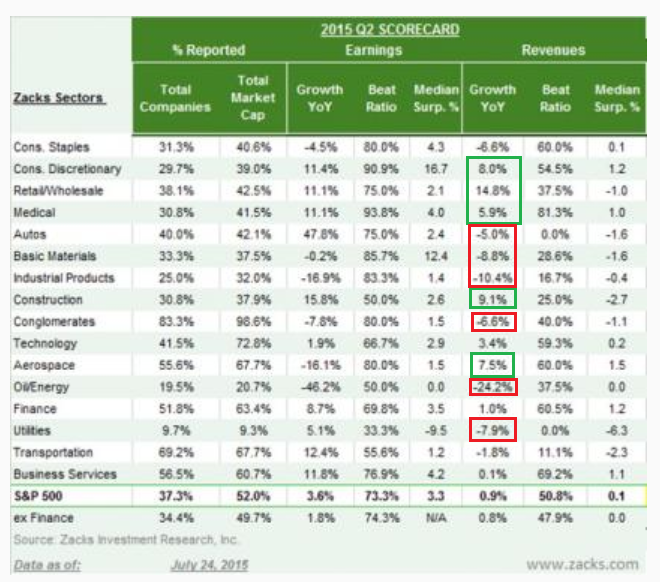
Yes, there are eight with revenue decreases, with energy and industrial products especially hard hit. But 8 sectors are up. And three of those increases are fairly strong with retail/wholesale of 14.8%, construction up 9.1% and aerospace up 7.5%. Although it’s still early, these numbers are encouraging. And this chart from the FRED system places the overall situation in more detail:
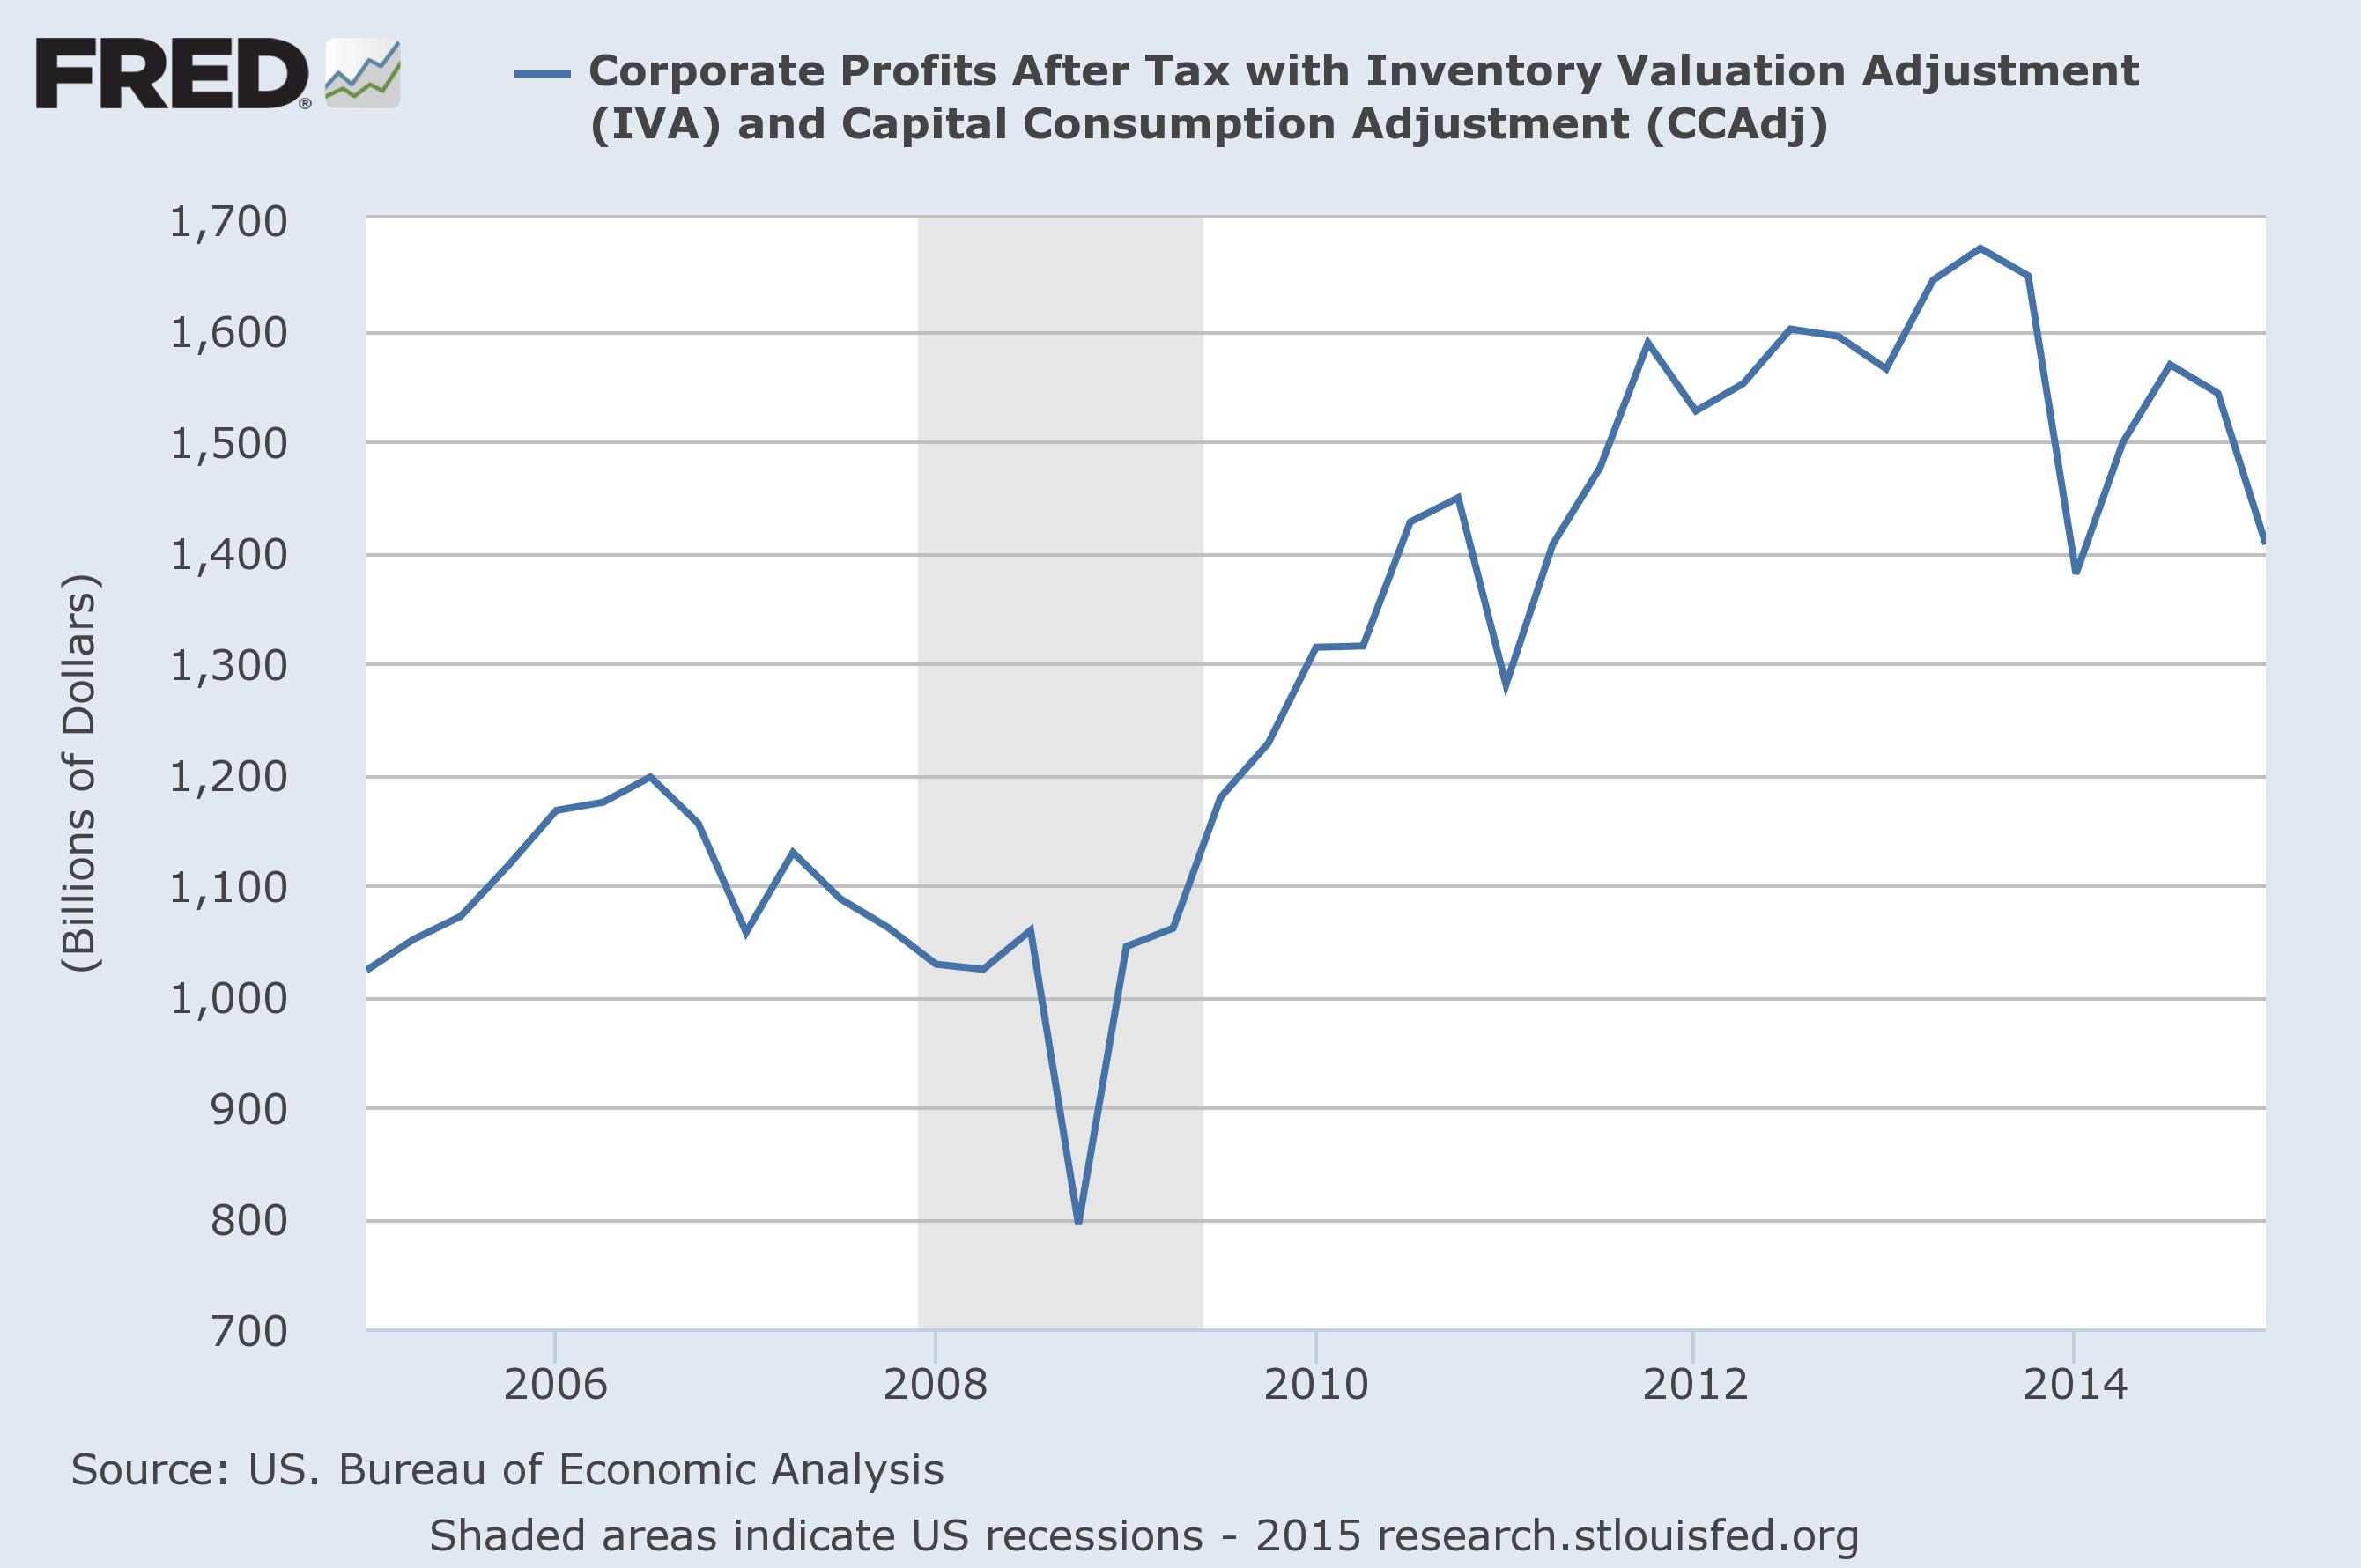
While corporate profits after tax and valuation adjustment levels are higher than their pre-recession levels, it’s been a far tougher slog for the last few years. There are numerous contributing factors: a rising dollar, weaker overseas economies, oil’s price drop and a weaker domestic demand.
Turning now to the markets, the transports are still very concerning:
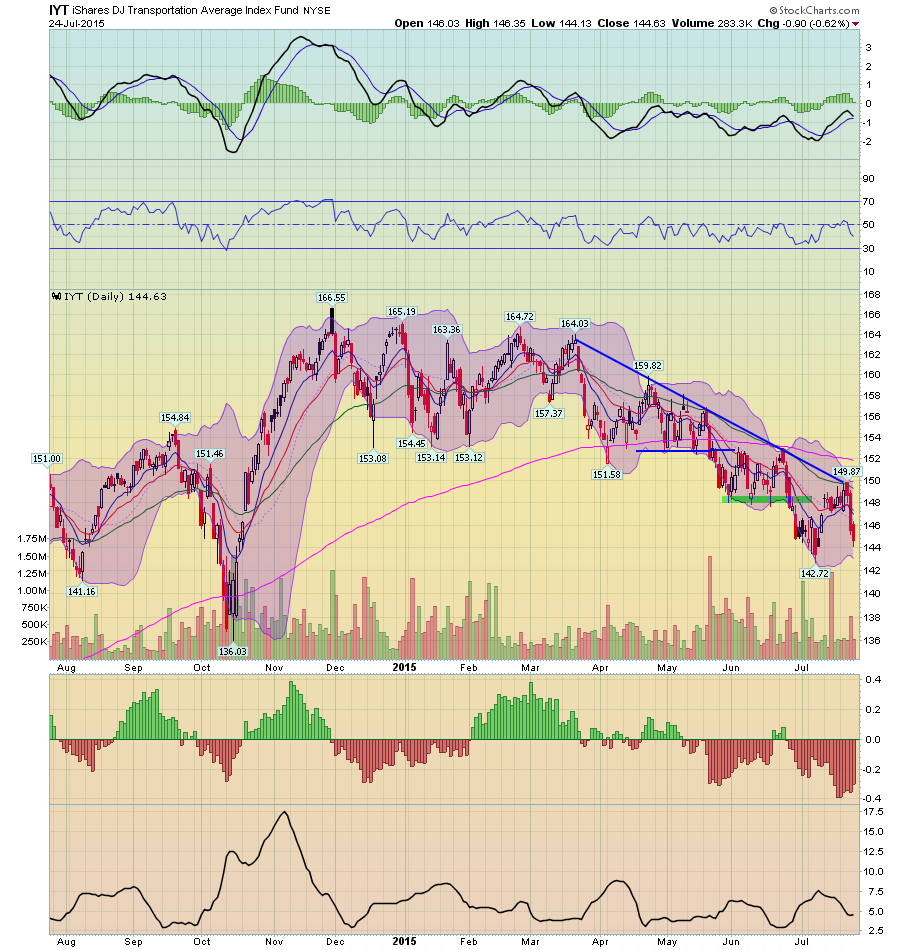
Since March, they have printed a string of lower lows and lower highs – making it four straight months of declines totaling a little over 12%. This is now a textbook “correction.” The sell-off has been disciplined. Some have argued this is a simple “return” to normalcy after an extended rally. However, this is occurring when oil prices are weak – a time when transports should be rallying due to the drop in their most expensive variable cost.
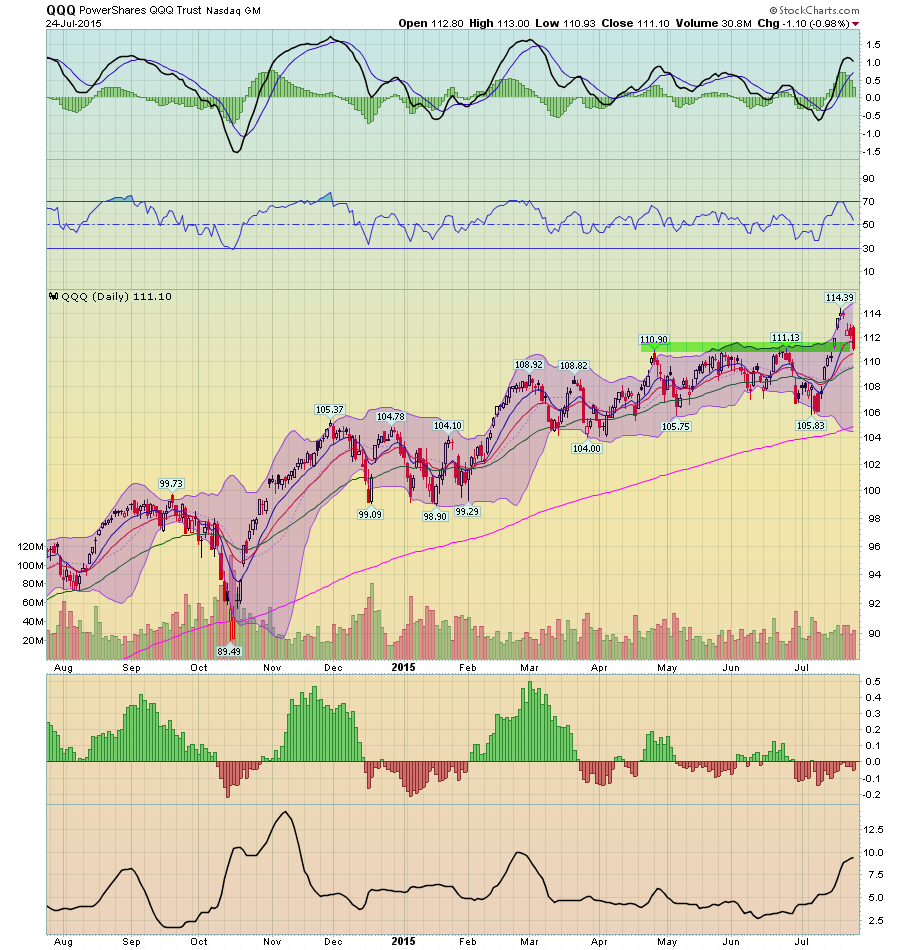
After breaking through resistance, the (NASDAQ:QQQ)s have fallen back through support at the 110-111 level.
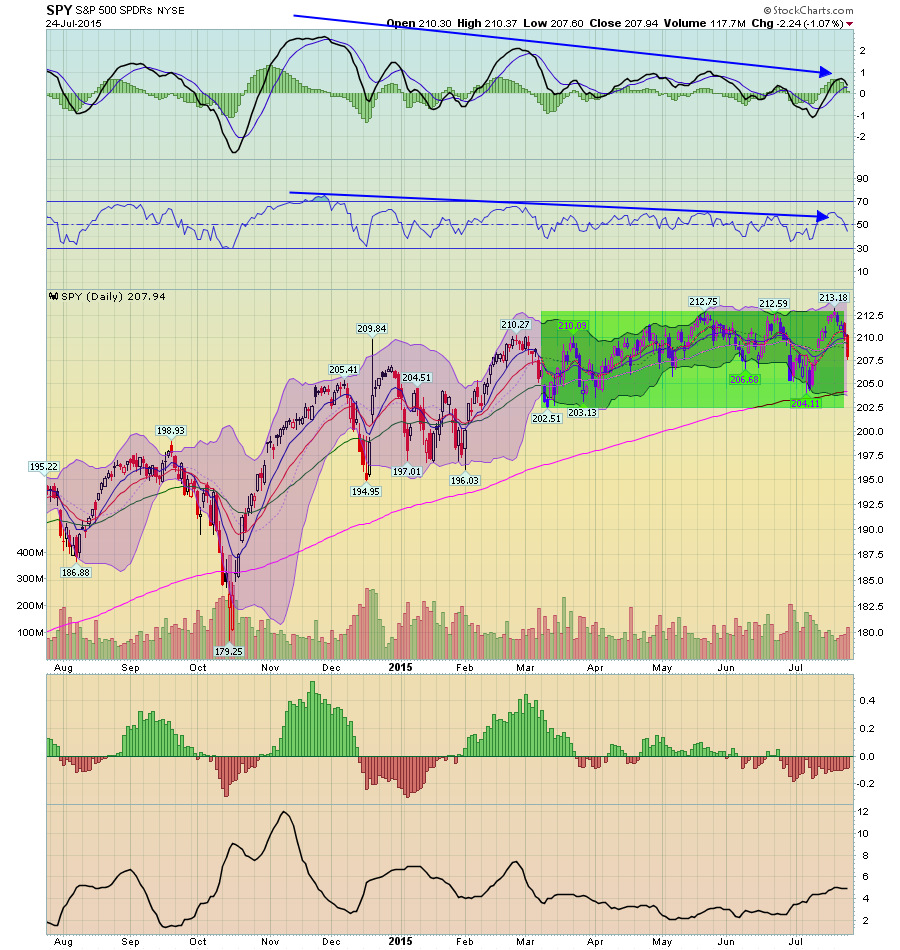
And the (ARCA:SPY)s continue in their multi-month, 10 points range:
Conclusion
We're in the middle of the summer doldrums. Half of the trading desks are either on a full-blown vacation or working a series of half-weeks. The news is generally positive, which is keeping a bid in the markets. But the expensive levels continues to put a sell-order in at resistance points. Barring a sudden change in the economic back-drop, I'd expect this to continue until the end of August.
