This past week’s economic news was mildly positive. On Tuesday, the Census released new home sales, which showed a stunning 16.6% M/M increase. This was the strongest pace since 1992 and the highest level since 2008. It’s difficult to overestimate the importance of this release.
Census released the durable goods report on Thursday. While the headline number showed a 3.4% rise, the ex-transports number was a more subdued .4%. Friday the BEA released the second estimate of 1Q GDP, which rose .8%. The internals remained soft. Personal consumption expenditures rose at the weakest pace in 4 quarters (+1.9%). All three investment sub-categories (structures,equipment, and intellectual property) declined while goods exports contracted for the second consecutive quarter. The only positive news was the very strong 17.1% increase in residential investment. The sum up: while the new home sales numbers were very encouraging, the weaker durable goods and 1Q GDP numbers indicate the economy still has larger-than-desired areas of weakness that are slowing growth.
The Atlanta Fed’s GDPNow model increased its projected 2Q growth rate to 2.9% while the NY Fed’s Nowcast predicts a 2.2% rate of expansion for an average of 2.55%. These are welcome developments, especially in light of the still weak 1Q GDP revisions.
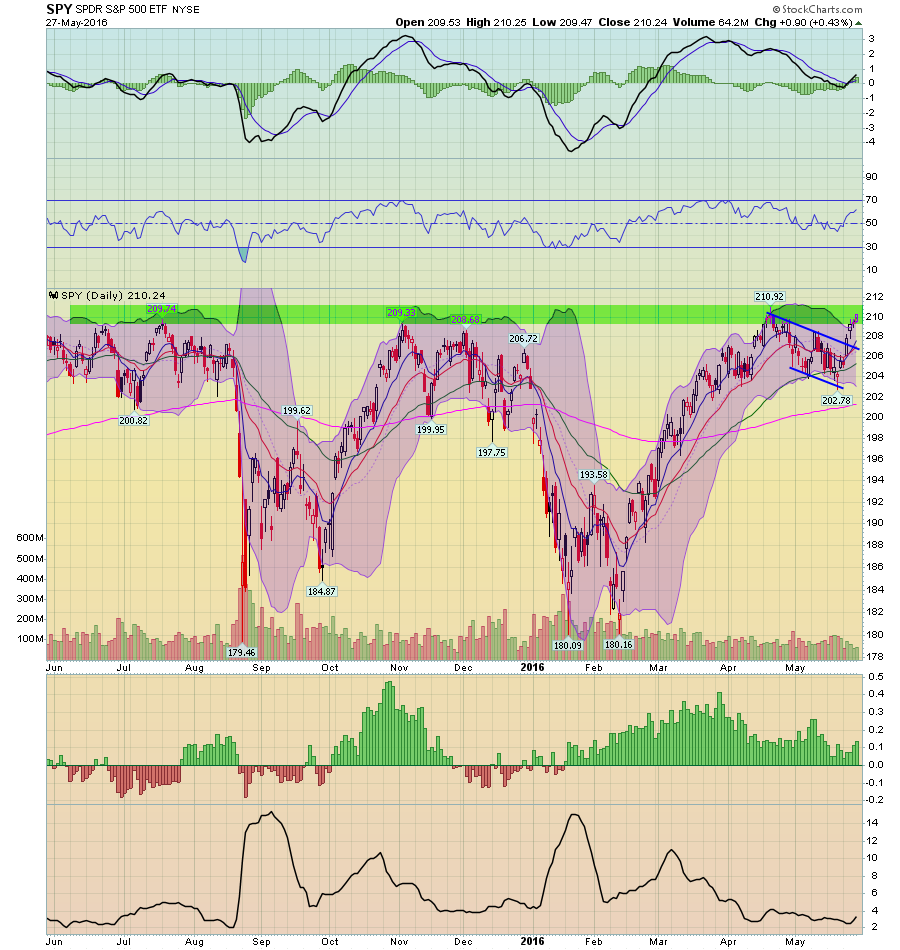
Turning to the markets, the S&P is once again approached the 210-212 area that has provided strong upside resistance for the last year:

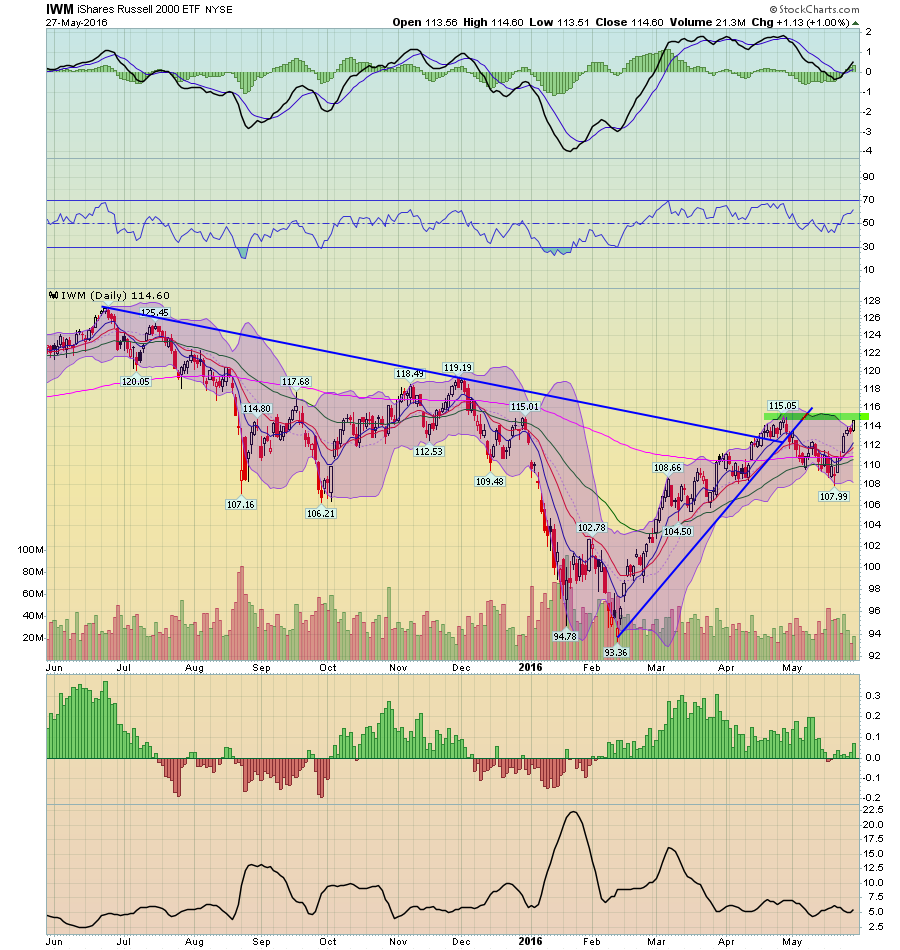
Could this time be different? Technically, it’s possible. Momentum (MACD, top panel) has plenty of room to move higher and prices are strengthening (RSI, second panel from the top). And the Russell 2000 – which is a proxy for overall risk appetite – could be following suit (via iShares Russell 2000 (NYSE:IWM)):

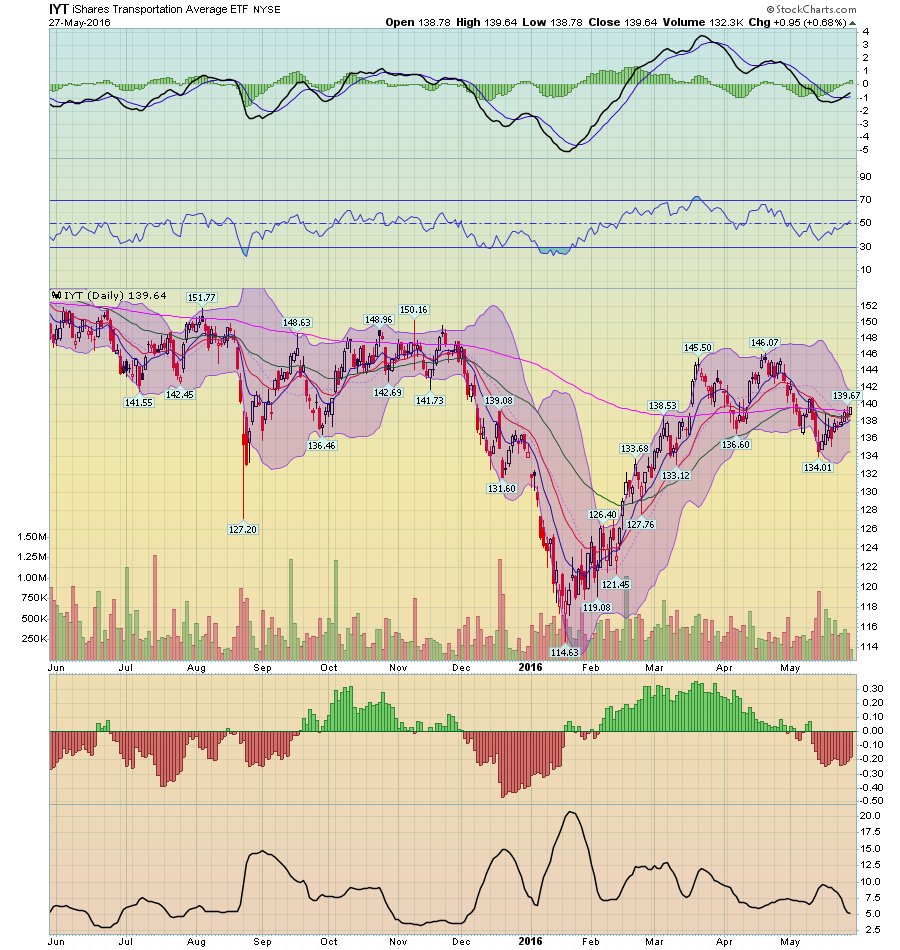
Prices moved through the 200 day EMA, then consolidated gains on a brief retreat to that indicator, followed by a rally to just below the short-term high of 115.05. The average has the same technical set-up as the SPDR S&P 500 (NYSE:SPY): strengthen prices and plenty of upside room for the MACD to rise. The transports, however, are less in agreement:

While the iShares Transportation Average (NYSE:IYT) has the same technical set-up (rising RSI and MACD), prices are entangled at the 200 day EMA which has provided upside resistance for the last year. As my co-blogger recently pointed out transportation statistics are very weak, which could indicate a slowing economy.
And then we have the earnings issue: to move higher, an expensive market needs rising revenue and earnings, which isn’t happening. From Zacks:
Retail aside, the Q1 earnings season is now effectively behind us, with results from 466 S&P 500 members already out. Total earnings for these 466 index members are down -7.0% from the same period last year on -1.2% lower revenues, with 71.5% beating EPS estimates and 55.6% coming ahead of top-line expectations.
And finally, it appears the Fed will continue “taking away the punch bowl” in the near future. While it’s possible we’ll see the SPYs move above the 210-212 level, it’s still very difficult to see a meaningful advance.
