This week, the Purchasing Managers Institute released their monthly reports on manufacturing and services. Manufacturing’s headline number decreased 1 to 50.8, with 11 sectors expanding. New orders and production pointed to continued increases with respective readings of 55.8 and 54.2. Finally, the anecdotal comments were mostly positive. The Services headline number increased 1.2 to 55.7. New orders and employment rose. The comments specifically mentioned labor shortages and low-cost inputs; only the oil sector received a negative mention.
U.S. Auto sales rose. Reuters reported:
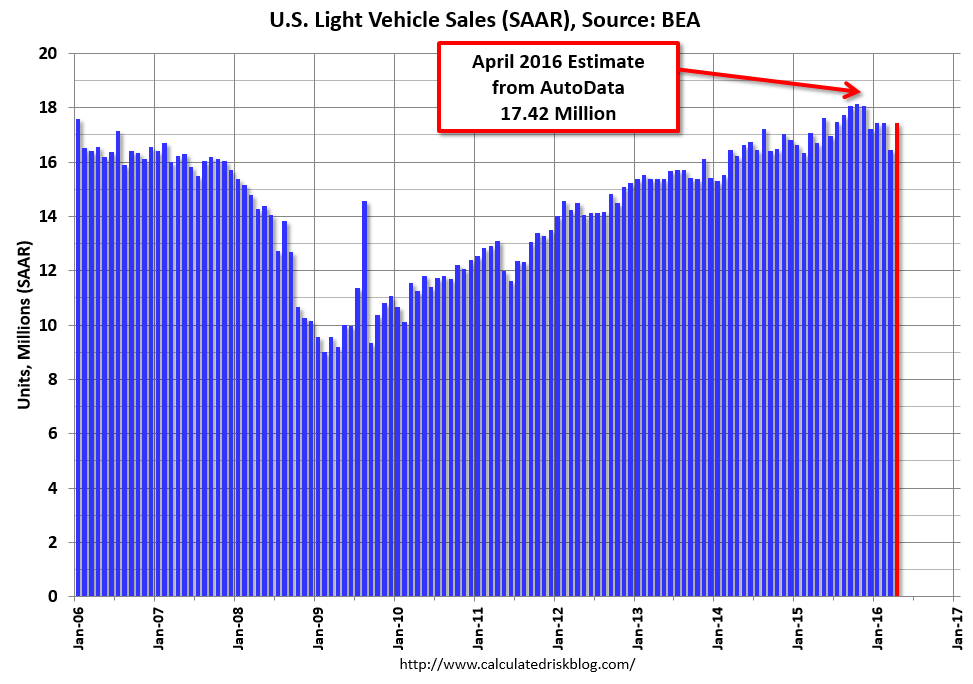
U.S. light vehicle sales in April totaled 1.51 million, up 3.6 percent from a year earlier, for a seasonally adjusted annualized rate of 17.42 million vehicles, according to Autodata Corp. WardsAuto said annualized sales were 17.32 million vehicles
U.S. auto sales in 2015 hit a record 17.4 million vehicles.
But there is growing concern sales may be peaking for this cycle. Over the last year, dealers and auto makers have increased incentives and lowered prices to entice buyers. And as this chart shows, sales are near peaks reached in the last expansion, leaving little room to move higher:
And finally, there was Friday’s weaker employment report, which showed an increase of 160,000 jobs. Consensus estimates called for an increase of ~200,000, making the headline number a big disappointment. Internals showed that weak growth in the retail and construction sector was the primary reason for the slowdown. Most concerning was the downward revision to previous months. True, the total revision was a statistically insignificant 19,000, or 8,500/month. But downward revisions typically occur in the later stages of an expansion.
The average projected 2Q growth rate of the Atlanta Fed, Cleveland Fed and Moody’s is 1.83%.
Economic Conclusion: the employment report is obviously the week’s biggest disappointment. As I noted in the bond market review, the miss could potentially alter the Fed’s position on this year’s rate hikes. More importantly, it could be a signal that the economy is decelerating. However, the ISM numbers were positive. And the manufacturing's internals indicate that sector's slowdown is probably over.
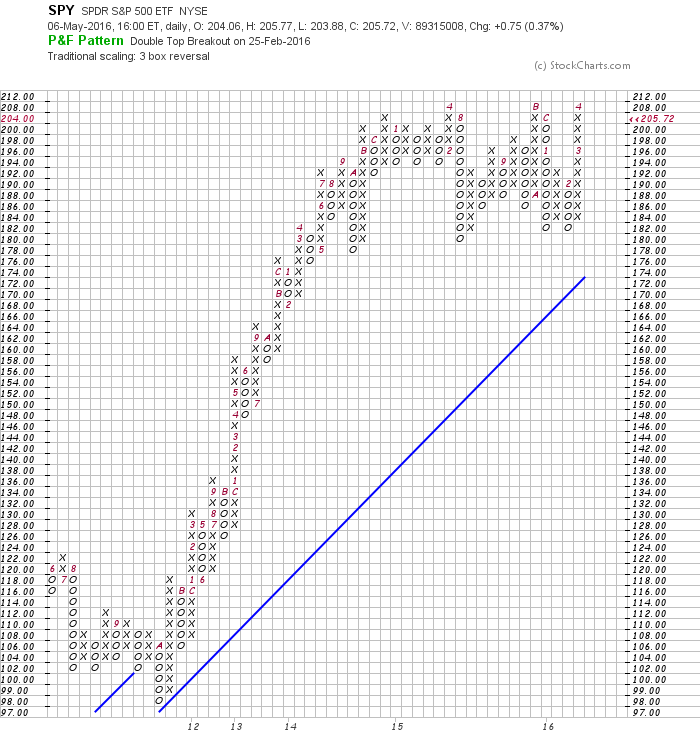
Turning to the markets, the SPDR S&P 500 (NYSE:SPY) are once again at key resistance levels, which is best shown by the P&F chart:
But other indexes are showing signs of weakness, starting with the transports:
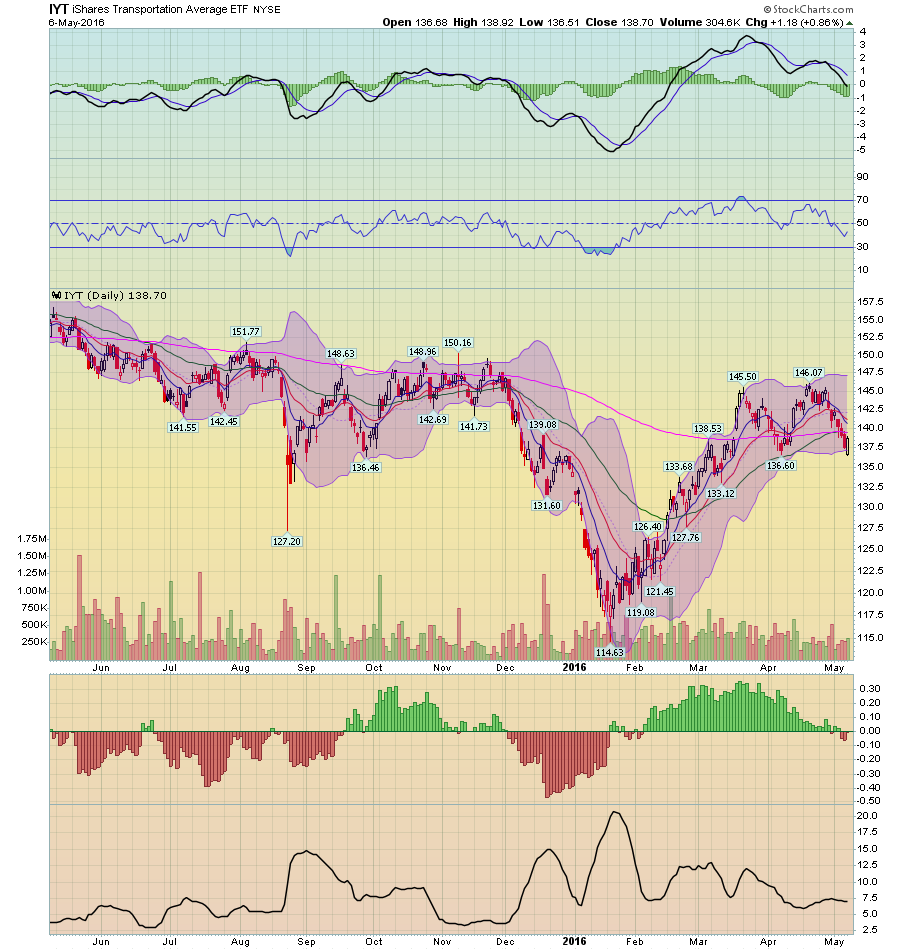
Earlier this year, the iShares Transportation Average (NYSE:IYT) rallied from 114 to 146. But the chart looks to be forming a double top. Prices are now below the 200 day EMA and momentum is declining. The Russell 2000 is also technically weak:
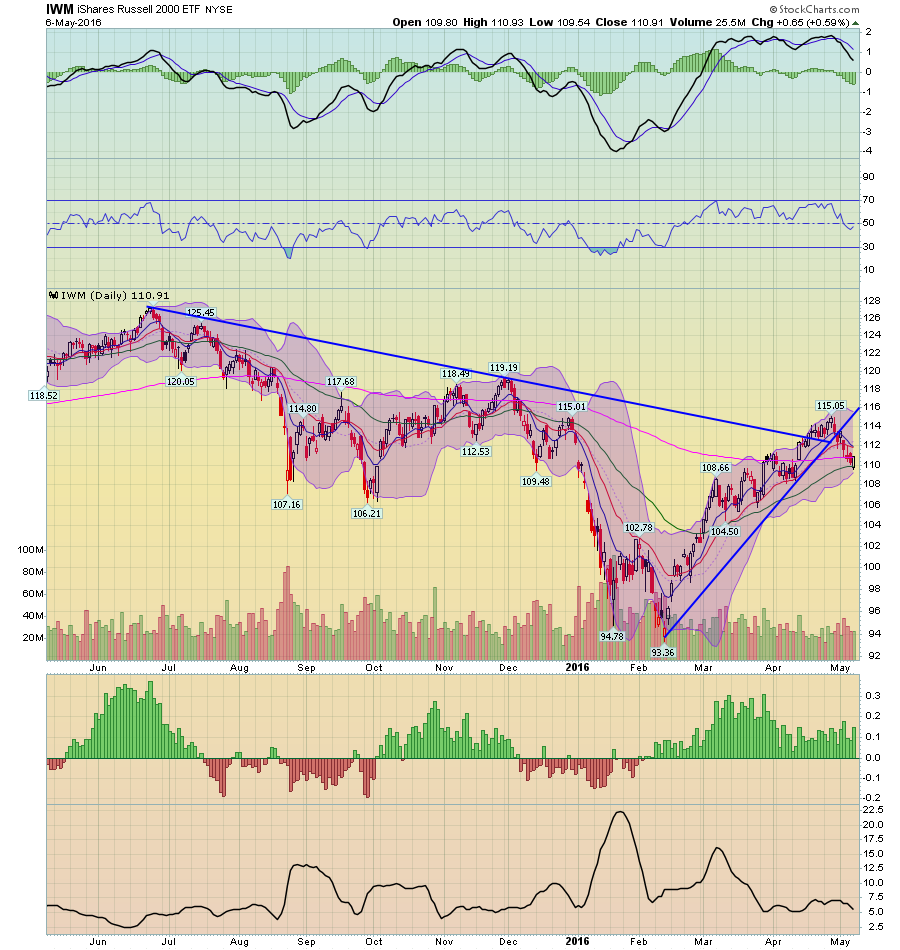
The daily chart broke support. Prices are below the 200 day EMA and momentum is weaker. The weekly chart shows a longer downward trend:
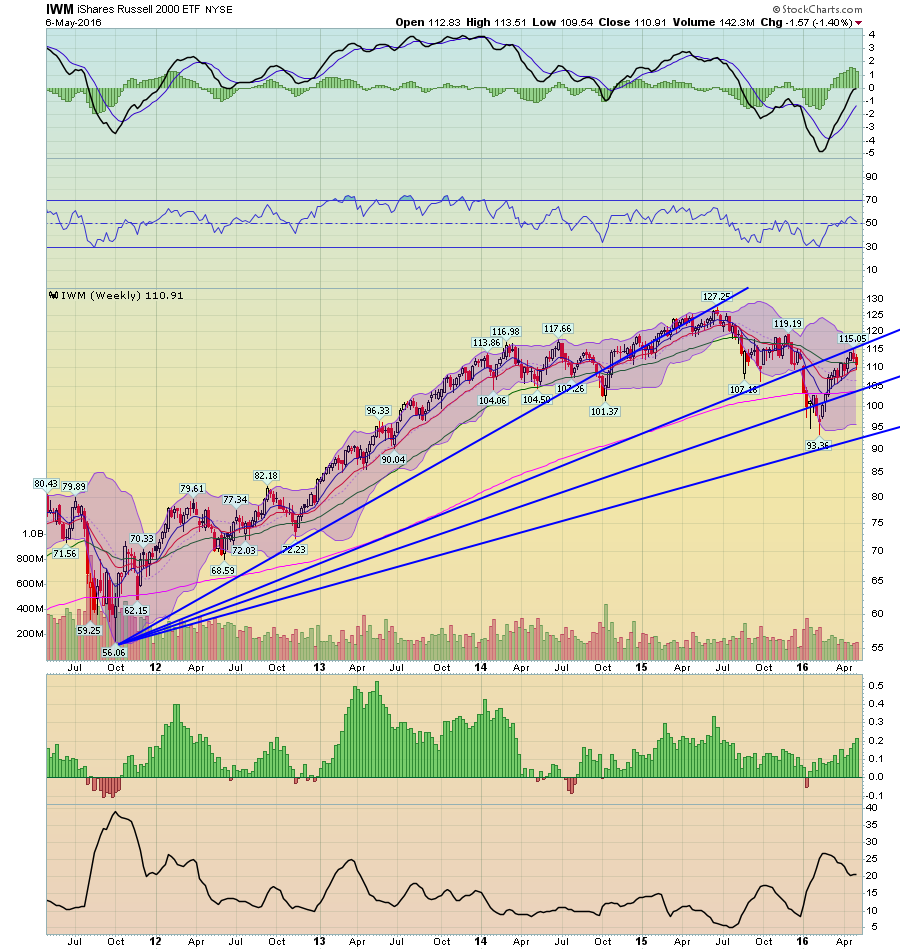
Prices are clearly forming a series of lower lows and lower highs.
And then we have declining participation:
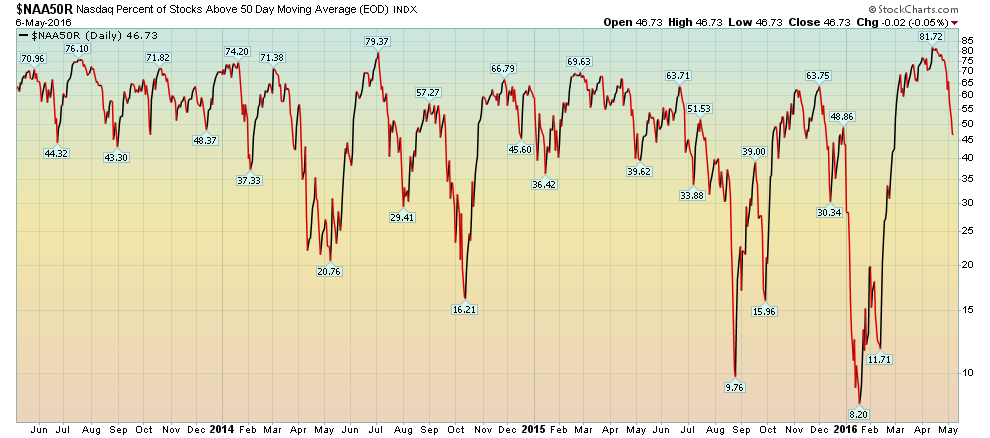
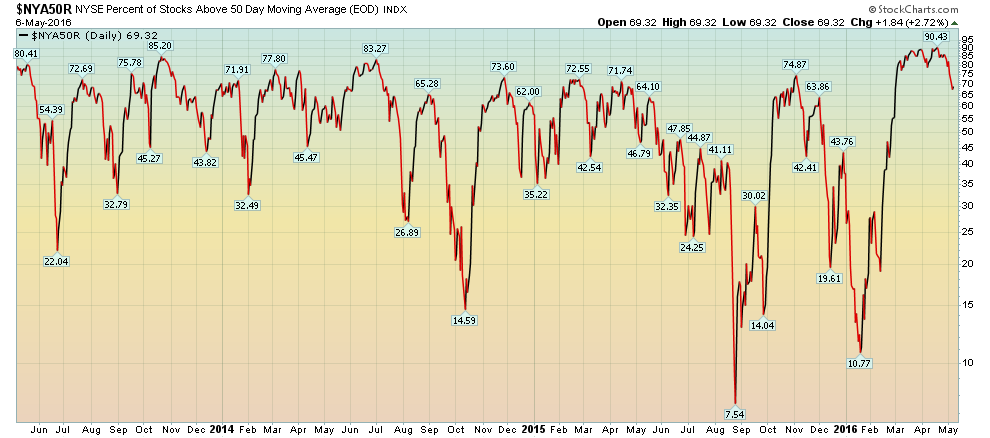
The top chart shows the number of NASDAQ stocks about the 50 day EMA. The number declined from a high of 81.72 to 46.73. The bottom chart shows the number of NYSE stocks about their 50 day EMA. That chart declined from a high of 90.43 to 69.32. The combined implication of these charts is for weaker price action, which is confirmed by the 1Q16 earnings results:
The bulk of the Q1 earnings season is now behind us, with results from 374 S&P 500 members or almost 75% of the index’s total membership already out. As we have been pointing out since the start of this earnings season, growth remains nonexistent, but the actual results are turning out to be less bad relative to the low levels to which estimates had fallen ahead of this reporting cycle. More companies are coming out with positive surprises for both earnings as well as revenues.
Total earnings for the 374 S&P 500 members that have reported results are down -7.5% from the same period last year on -1.9% lower revenues, with 71.4% beating EPS estimates and 56.4% coming ahead of top-line expectations. The side-by-side charts below compare the results thus far with what we have seen from the same group of 374 S&P 500 members in other recent periods.
However, I'm not predicting a crash. Instead, I see meandering lower price action caused by weak earnings and economic growth.

