- All Instrument Types
- Indices
- Equities
- ETFs
- Funds
- Commodities
- Currencies
- Crypto
- Bonds
- Certificates
Please try another search

U.S. Election May Trigger Major Bottom In Stocks – PART 1

Almost like clockwork, our research team at Technical Traders predicted on September 17 that the U.S. stock market would turn lower and attempt a 5~8% downside move on or after September 21, headed into the U.S. mid-term elections. Our analysis of the potential downside move was related to our price modeling systems expectations that a common predicted downside target existed between -5% and -8%. Our researchers did not believe the markets would fall much below -10% before hammering out a price bottom and finding support.
Today, we are just 7~10 days away from the U.S. mid-term elections and if our predictions hold true, we will be establishing a price bottom in the U.S. stock markets over the next 5+ trading days and begin a new upside price rally fairly quickly after the election results are known. We could interpret this as “a period of uncertainty that is mixed with economic and news data,” which results in investors pulling out of the markets ahead of these types of global events. In all reality, the U.S. elections are really a global event for many investors. Policies, regulations, taxes, objectives and execution become a very big question for many as these elections take place. Hundreds of billions of dollars are exposed to risk in the weeks headed into the elections and thus, global investors and traders are always cautious headed into a major U.S. election.
Volatility
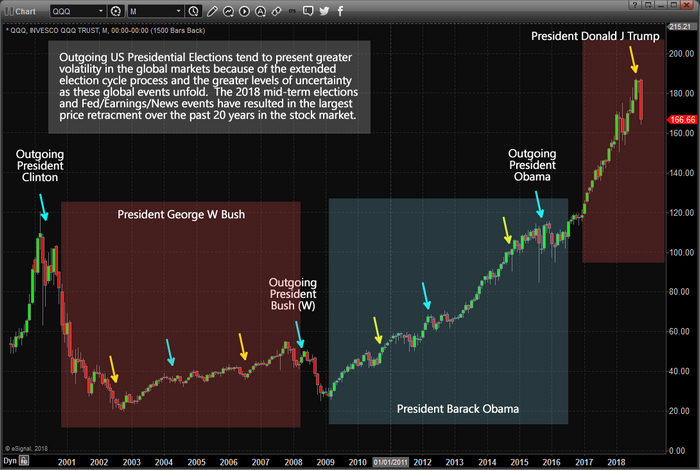
Our theory is that this phenomenon has become even more volatile in recent years and global political ideals have become further polarized. We believe that when a sitting U.S. president who has served for two terms is leaving office, far greater volatility enters the global markets typically. We believe that mid-term U.S. elections, depending on the political climate at the time, may or may not reflect broad global market concerns and volatility. We’ve highlighted major U.S. presidential elections and U.S. Mid-Term elections on the chart below so you can see how volatility and price rotation increase or decrease depending on the political climate and uncertainty associated with these elections. We’ve noted 6+ months (or longer) before presidential elections and a few months before mid-term elections.
The current election event, November 6, 2018, is somewhat unique as it also coincides with the U.S. Fed having raised rates considerably over the past 2+ years as well as after a dramatic price increase in U.S. equities markets following the election of President Donald J. Trump. You can clearly see from the chart below that the QQQ has increased by nearly $80+ over the past two years while that same $80 increase existed over the entire Obama stock market recovery (8 years). This reflects the amount of increased volatility and activity that is within the current global capital market.
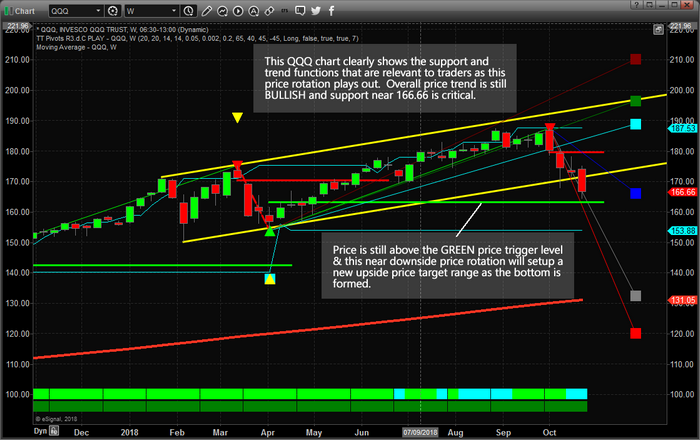
This weekly QQQ chart highlights what we believe to be the core elements of this election cycle rotation. On the weekly chart, the overall price trend is still BULLISH (see the DARKER GREEN blocks near the bottom of the chart) and the bullish price trigger level near $163 is still valid. Yes, the shorter-term price trend is BEARISH and has been so since the week of October 8. You can see the bearish price trigger level near $179 (in red) that was recently breached and the downside price target level (in blue) near $166.
Our expectations from our predictions that the markets would be rotated lower by 5~8% were that the markets would move toward the lower YELLOW price channel level and stall near these levels (or just below them). We did not expect the extended price decline that was a result of earnings and housing data released last week. We still believe this move has already reached its downside objectives and is in the process of setting up a major bottom formation. We believe the extended move was an emotional price reaction to a hyper-election environment in the U.S. urge caution in the global capital markets.
Next, let's take a look at additional technical, price and modeling systems that support our belief of a major bottom formation setting up in U.S. stocks and how election-cycle events should be played for success. This current downside price rotation has extended to below our expected levels – much like a deeper “washout low” price formation. We continue to believe the next 7+ trading days will hammer out a bottom formation and that the U.S. equities will resume an upside advance shortly after the elections are completed and throughout the remainder of 2018.
Related Articles

If there was a "Stock of the Year" award, it would certainly go to Nvidia (NASDAQ:NVDA). As a result of the continued AI boom, the market cap of this semiconductor manufacturer...

A data provider tracks the stocks trades of members of Congress An asset management firm created two ETFs tracking how Congress members invest The Democratic and...

Below we can see how the top stocks in the S&P 500, as tracked by the Invesco S&P 500® Top 50 ETF (NYSE:XLG), have gained 22.5% in 2024. That easily beats the SPDR®...
Are you sure you want to block %USER_NAME%?
By doing so, you and %USER_NAME% will not be able to see any of each other's Investing.com's posts.
%USER_NAME% was successfully added to your Block List
Since you’ve just unblocked this person, you must wait 48 hours before renewing the block.
I feel that this comment is:
Thank You!
Your report has been sent to our moderators for review


Add a Comment
We encourage you to use comments to engage with other users, share your perspective and ask questions of authors and each other. However, in order to maintain the high level of discourse we’ve all come to value and expect, please keep the following criteria in mind:
Enrich the conversation, don’t trash it.
Stay focused and on track. Only post material that’s relevant to the topic being discussed.
Be respectful. Even negative opinions can be framed positively and diplomatically. Avoid profanity, slander or personal attacks directed at an author or another user. Racism, sexism and other forms of discrimination will not be tolerated.
Perpetrators of spam or abuse will be deleted from the site and prohibited from future registration at Investing.com’s discretion.