
The US dollar continued to slide yesterday and today in Asia, perhaps due to Fed Chair Powell pouring cold water on QE-tapering expectations on Wednesday. EU and US equities traded higher, perhaps for the same reason, but Asian stocks tumbled, maybe due to concerns over tight regulations in China, or end-of-month profit taking. Today, all lights could fall on the Eurozone inflation data, which we expect to reinforce the ECB’s dovish message.
Powell's Remarks Keep Weighing On US Dollar, Eurozone Inflation Under The Radar
The US dollar continued to slide against all the other major currencies on Thursday and during the Asian morning Friday. It fell the most versus NZD, CAD, and CHF in that order.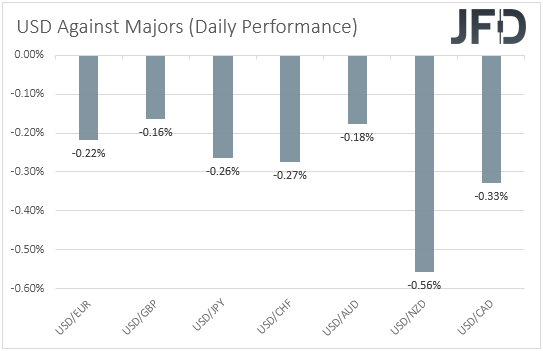
The weakening of the US dollar and the strengthening of the risk-linked Kiwi and Loonie suggest that markets continued trading in a risk-on fashion. That said, the strengthening of the Swiss franc points otherwise. Thus, in order to clear things up with regards to the broader investor morale, we prefer to turn our gaze to the equity world. There, major EU and US indices were a sea of green, but today in Asia, all major indices tumbled, with Japan’s Nikkei 225 losing the most ground.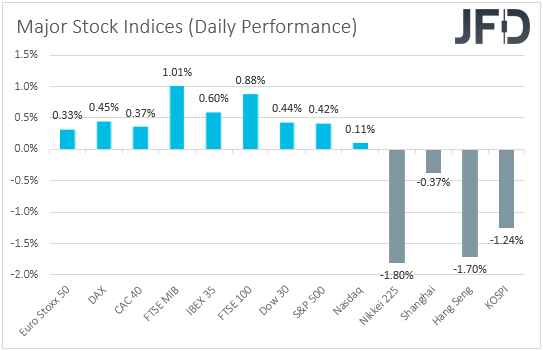
Yesterday, we noted that with Fed Chair Powell pouring cold water on QE-tapering expectations, the dollar could stay under selling interest for a while more, while equities could keep drifting north. We were right about the dollar, and we still expect it to continue declining in the short run, but with regards to equities, we were correct only until yesterday’s US session.
Today in Asia, the picture was very different, and this may have been due to concerns over tight regulations in China resurfacing. It could also be end-of-month profit taking, due to portfolio and risk-exposure rebalancing, which could roll over into the EU and US sessions today. In any case, with the Fed disappointing those expecting hints over when it may start tapering its bond purchases, and the ECB adamant that it is too early to start withdrawing stimulus, EU and US equities may rebound at the beginning of the next month and perhaps conquer fresh record highs. However, we cannot say the same about Asian indices, the technical pictures of which continue to suggest downtrends.
As for today, the main item on the agenda may be Eurozone’s preliminary CPIs for July, and the first estimate of the bloc’s GDP for Q2. Eurozone’s headline CPI is forecast to have ticked up to +2.0% yoy from +1.9%, while the HICP excluding energy and food rate is anticipated to have slid to +0.7% yoy from +0.9%. This comes in contrast with Germany’s rates, which surged and even beat their estimates. The qoq GDP rate is forecast to have rebounded to +1.5% from -0.3%. However, if indeed, the bloc’s inflation numbers are as soft as expected, they will confirm the ECB’s dovish stance last week. Remember that the Bank changed its forward guidance, saying that it will keep interest rates at present or lower levels until it sees inflation reaching 2% well ahead of the end of its projection horizon, which may also imply a period during which inflation moderately overshoots that objective.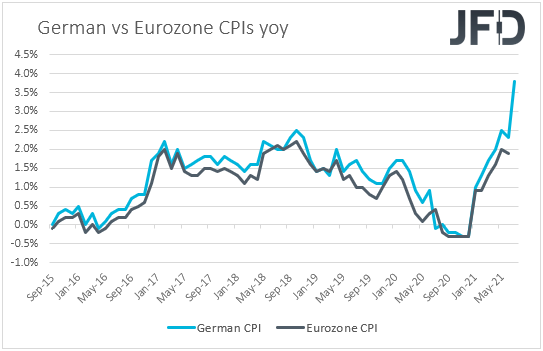
In our view, this translates into willingness to hold rates low for much longer than the previous guidance suggested and may keep the euro under selling interest. However, euro traders have already discounted to some extend the idea of the ECB staying sidelined, while dollar traders may have just started digesting, or let’s say pricing in, Powell’s remarks from Wednesday’s press conference. With that in mind, we would expect EUR/USD to drift somewhat higher in the short run. We believe that the euro may continue losing ground against the Kiwi, the central bank of which is expected to hit the hike button soon, perhaps as early as next month.
Nikkei 225 Technical Outlook
Th Nikkei 225 cash index tumbled overnight after it hit resistance at 27940. Overall, the index remains below the downside resistance line drawn from the high of June 15th, and thus, we would consider the short-term outlook to be negative.
At the time of writing, the index is trading slightly below the low of July 27, a break that may have opened the door towards the low of July 19, at 27065. If that barrier does not hold this time, its break may allow declines towards the 26740 zone, which is defined as a support by the inside swing high of Dec. 23, where another break could extend the slide toward the 26310 area, which provided support between Nov. 20 and Dec. 21.
On the upside, we would like to see a break back above 28255 before we start examining a bullish reversal. The index could then travel to the 28455 level, the break of which could pave the way towards the 28710 or 28855 territories, marked by the highs of July 14 and 13 respectively. If neither area is able to stop the advance, then the next hurdle to consider as a resistance may be at 29165, marked by the high of June 25.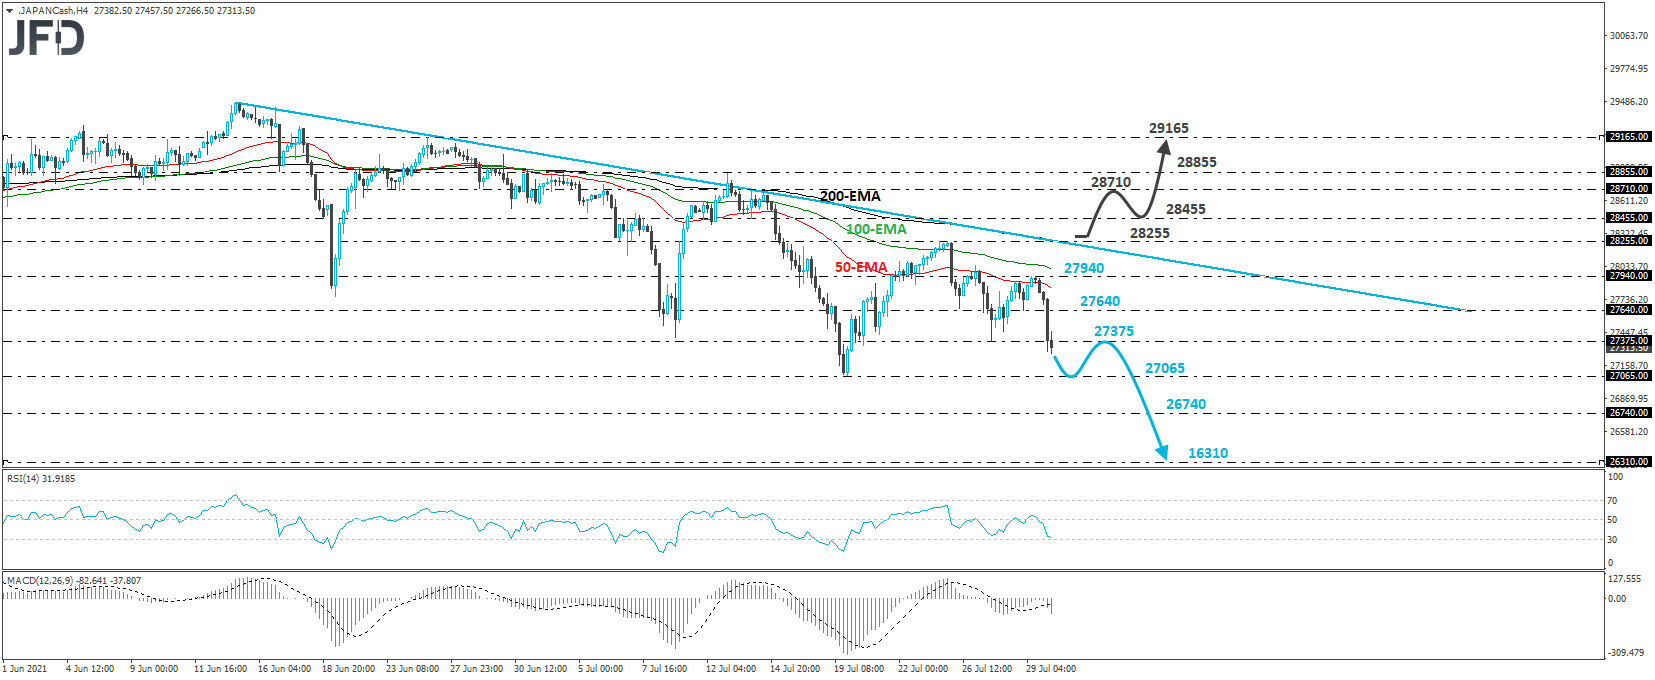
EUR/USD Technical Outlook
EUR/USD has been in a recovery mode since Wednesday, when Fed Chief Powell disappointed those expecting hints with regards to QE tapering. Despite the prior trend being to the downside, we believe that the break above the key resistance (now turned into support) barrier of 1.1825 may have turned the short-term outlook to a positive one.
Yesterday, the rate hit the 1.1895 zone and then, it pulled back. However, we see decent chances for the bulls to take charge again soon, perhaps from near the 1.1825 barrier, and push the action above 1.1895. Such a break could open the way towards the 1.1950 or 1.1990 zones, with the break of the latter one opening the way towards the 1.2050 obstacle, defined as a resistance by the inside swing low of May 13.
In order to start assessing whether the prior downtrend has resumed, we would like to see a dip below 1750. This will confirm a forthcoming lower low on the daily chart and may initially target the low of Mar. 31, at 1.1705. Another break, below 1.1705 could carry larger bearish implications, perhaps setting the stage for declines towards the low of Nov. 2, at 1.1620.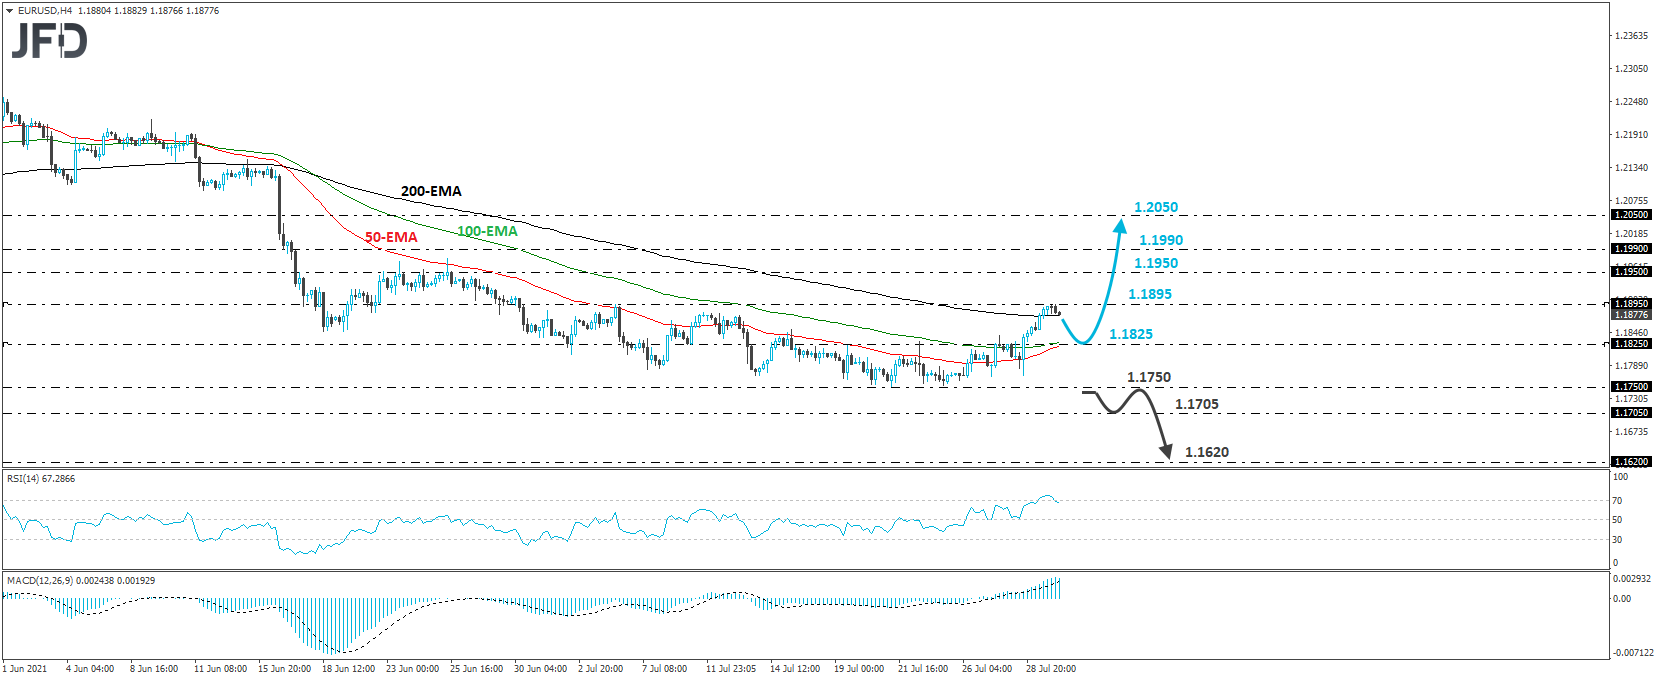
As For The Rest Of Today's Events
Later in the day, we get the US personal income and spending data for June, alongside the core PCE index for the month. Personal income is expected to have declined again, but at a slower pace than the previous month, while spending is forecast to have slowed somewhat. The final UoM consumer sentiment index for July is also due to be released and it is just expected to confirm its preliminary estimate of 80.8. From Canada, we have the monthly GDP for May, with expectations pointing to a 0.3% mom contraction, the same as in April.