
EUR/USD: U.S. core inflation gets higher, retail sales rise
Macroeconomic overview:
- Underlying U.S. consumer prices increased in October on the back of a pickup in rents and healthcare costs, bolstering the view that a recent disinflationary trend worrying the Federal Reserve probably had ended.
- The rise in the consumer price index, excluding the volatile food and energy categories, reported by the Labor Department on Wednesday likely clears the way for the U.S. central bank to raise interest rates next month.
- October's gain in the so-called core CPI, which measures underlying inflation pressures, could comfort Fed officials concerned that stubbornly low inflation may reflect not only temporary factors but also more persistent developments.
- The core CPI rose 0.2% mom and 1.8% yoy in October. It edged up 0.1% mom and 1.7% yoy in September.
- The data suggest the Fed's preferred inflation measure, the personal consumption expenditures (PCE) price index excluding food and energy, probably rose 0.2% in October, which would snap five straight monthly 0.1% gains. That would raise the year-on-year increase in the core PCE price index to 1.4 % from 1.3% in September.
- The core PCE price index has consistently undershot the Fed's 2% target for more than five years. The central bank has lifted borrowing costs twice this year and has projected three rate increases in 2018. The government will publish core PCE price index data later this month.
- Overall consumer prices, however, rose marginally in October as the boost to gasoline prices from hurricane-related disruptions to Gulf Coast oil refineries was unwound. The CPI nudged up 0.1% last month after jumping 0.5% in September. That lowered the year-on-year increase in the CPI to 2.0% from 2.2% in September.
- Low inflation is, however, helping to underpin consumer spending. In a separate report on Wednesday, the Commerce Department said retail sales increased 0.2% last month as heavy price discounting by automobile manufacturers buoyed purchases of motor vehicles. Data for September was revised to show sales jumping 1.9%, which was the largest gain since March 2015, rather than the previously reported 1.6% advance. Retail sales increased 4.6% on an annual basis.
- The slowdown in retail sales from September's robust pace largely reflected an unwinding of the boost to building materials and gasoline prices after recent hurricanes.
- Excluding automobiles, gasoline, building materials and food services, retail sales increased 0.3% last month after climbing 0.5% in September. These so-called core retail sales correspond most closely with the consumer spending component of GDP. Last month's increase in core retail sales indicated a healthy pace of consumer spending at the start of the fourth quarter.
- Boston Fed President Eric Rosengren said falling unemployment and sustained growth mean the U.S. economy has accelerated beyond a sustainable level so the Federal Reserve should continue to raise interest rates, including next month.
- The data stopped a severe USD correction from the uptrend that began in early September on hopes of a tax cut deal.
Technical analysis and trading signals:
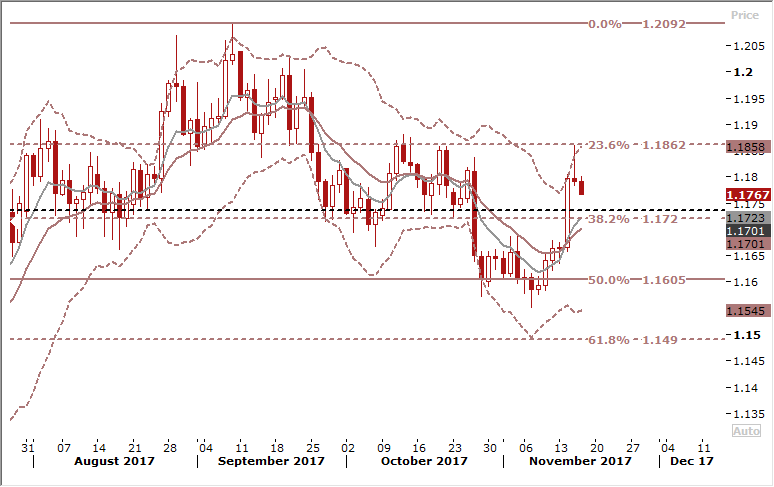
- We see a shooting star pattern on candles after Wednesday’s sharp fall from 1.1862. Failure inside the cloud and the close back below suggest further pullback action is due.
- Underlying trend is bullish so use dips as fresh buying opportunities. We stay long at 1.1714 for 1.1960.
USD/CAD: Loonie drops on oil and stocks slide
Macroeconomic overview:
- The CAD weakened to a one-week low against the USD on Wednesday as oil and stocks fell and investors weighed trade uncertainties ahead of fresh NAFTA talks.
- On Tuesday, Canada launched a NAFTA challenge of a U.S. decision earlier this month to impose duties on softwood lumber exports from its northern neighbor. The U.S. Commerce Department accuses Canada of unfairly subsidizing and dumping softwood lumber, which is commonly used in the construction of homes. Canada denies it is dumping the lumber.
- NAFTA working groups are due to begin meeting from Wednesday in Mexico. Talks will begin on Friday and continue through November 21.
- Prices of oil, one of Canada's major exports, slipped for a fourth day on a gloomy outlook for oil demand growth from the International Energy Agency. On Tuesday, the IEA cut its oil demand growth forecast by 100k barrels per day for both 2017 and 2018. That could mean world oil consumption may not breach 100 million bpd next year as many had expected. Also, supplies are likely to exceed that level, particularly as U.S. production continues to rise.
- World stocks registered their longest losing streak in eight months, while the USD recovered early losses against a basket of major currencies as U.S. data boosted expectations for further Federal Reserve interest rate hikes.
- Bank of Canada Senior Deputy Governor Carolyn Wilkins said a cautious approach to monetary policy may be prudent during times of uncertainty like today, but caution has its limits because the trade-off can be financial instability. Explaining how uncertainty affects decision-making at the bank, Wilkins said policy may respond to negative shocks more aggressively when interest rates are low, but a cautious approach is prudent when it is not clear how rate moves will affect spending.
- The Bank of Canada raised rates in back-to-back moves in July and September but policymakers have since said that while less stimulus will be required over time, they will be cautious as they consider future rate moves. Wilkins said the bank is particularly focused on data that indicate how wages and potential output are progressing, as well as the effects of the rate hikes and the renegotiation of the North American Free Trade Agreement.
- Canada's manufacturing sales data for September is due on Thursday and an October inflation report will be released on Friday.
Technical analysis and trading signals:
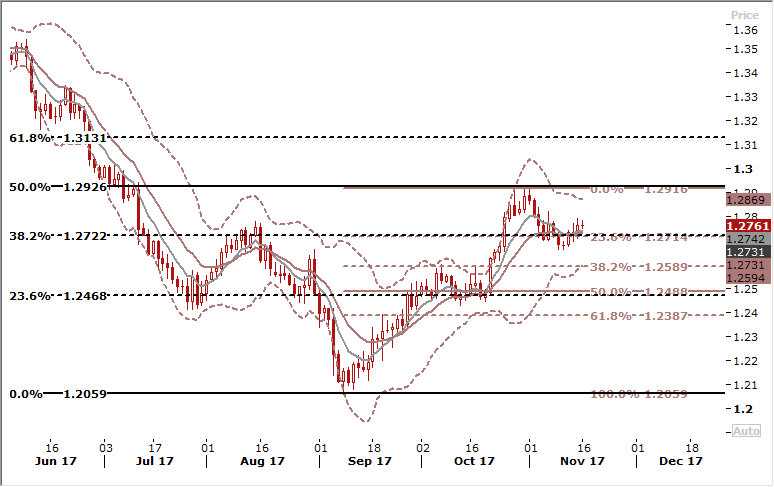
- Short-term moving averages have flattened and the USD/CAD is fluctuating around them. The pair broke below the 23.6% fibo of September-October rise but did not manage to stay below.
- Daily chart does not show any clear signal, while weekly chart still points to the downward move. We stick to our short position opened at 1.2815 with the target at 1.2550.
TRADING STRATEGIES SUMMARY:
FOREX - MAJOR PAIRS: 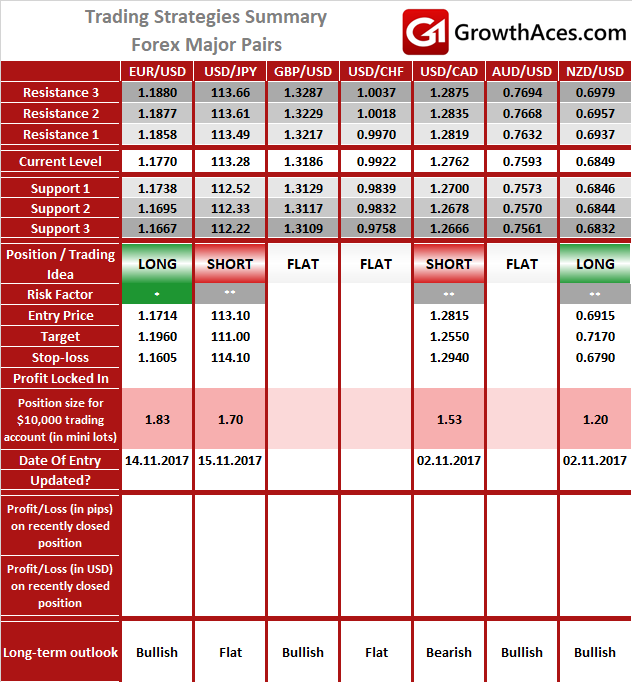
FOREX - MAJOR CROSSES: 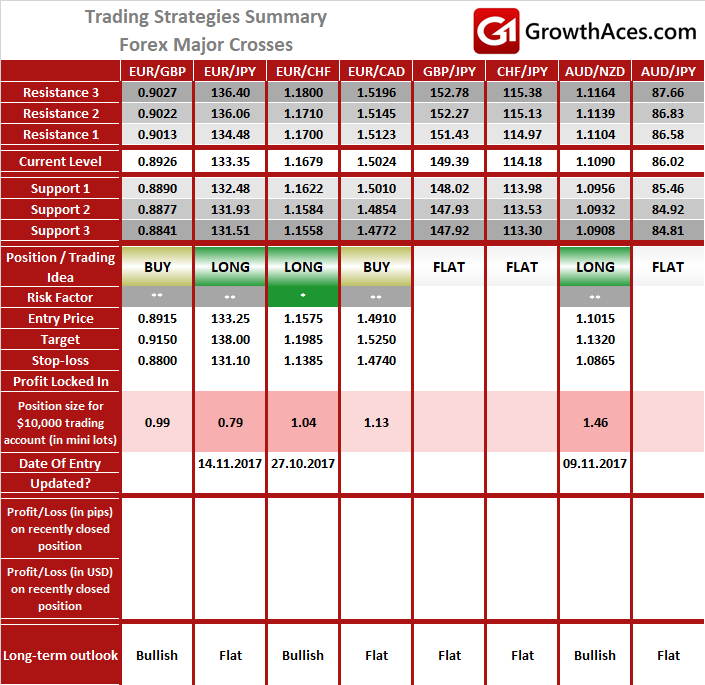
PRECIOUS METALS: 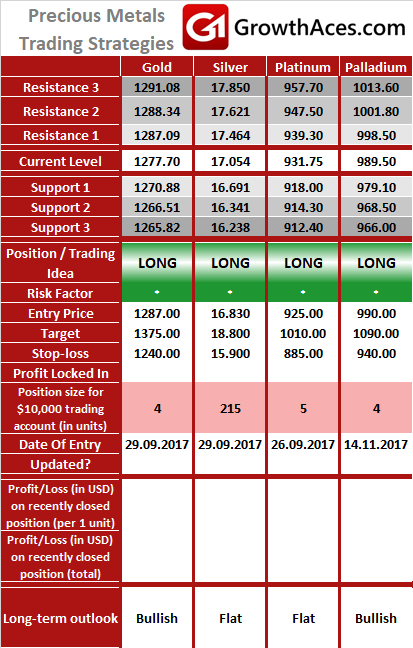
How to read these tables?
1. Support/Resistance - three closest important support/resistance levels
2. Position/Trading Idea:
BUY/SELL - It means we are looking to open LONG/SHORT position at the Entry Price. If the order is filled we will set the suggested Target and Stop-loss level.
LONG/SHORT - It means we have already taken this position at the Entry Price and expect the rate to go up/down to the Target level.
3. Stop-Loss/Profit Locked In - Sometimes we move the stop-loss level above (in case of LONG) or below (in case of SHORT) the Entry price. This means that we have locked in profit on this position.
4. Risk Factor - green "*" means high level of confidence (low level of uncertainty), grey "**" means medium level of confidence, red "***" means low level of confidence (high level of uncertainty)
5. Position Size (forex)- position size suggested for a USD 10,000 trading account in mini lots. You can calculate your position size as follows: (your account size in USD / USD 10,000) * (our position size). You should always round the result down. For example, if the result was 2.671, your position size should be 2 mini lots. This would be a great tool for your risk management!
Position size (precious metals) - position size suggested for a USD 10,000 trading account in units. You can calculate your position size as follows: (your account size in USD / USD 10,000) * (our position size).
6. Profit/Loss on recently closed position (forex) - is the amount of pips we have earned/lost on recently closed position. The amount in USD is calculated on the assumption of suggested position size for USD 10,000 trading account.
Profit/Loss on recently closed position (precious metals) - is profit/loss we have earned/lost per unit on recently closed position. The amount in USD is calculated on the assumption of suggested position size for USD 10,000 trading account.
Source: GrowthAces.com - daily forex trading strategies