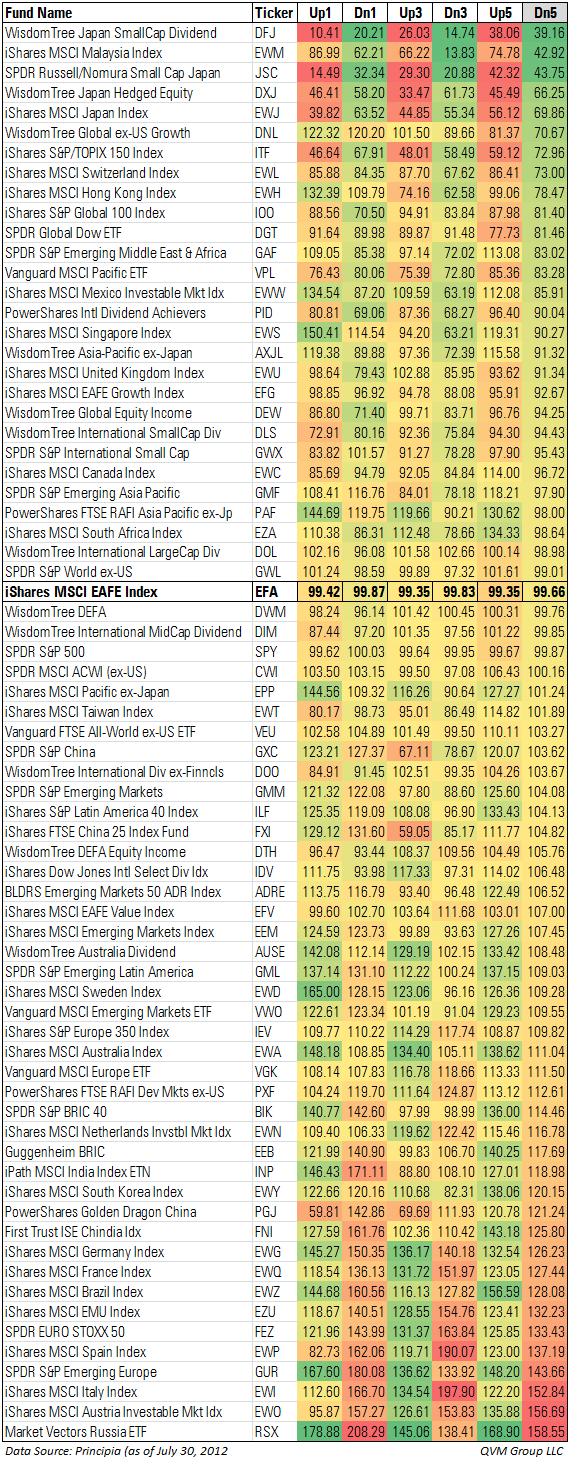
It is important to be aware of the tendency of stock funds to participate in an up market move or down market move. Ideally, one would be in funds that tend to capture all or more of the move of a benchmark during an up market, and in funds that tend to capture significantly less of the move of the benchmark during a down market.
Those relative moves are called the “capture ratios”. The table below lists the upside and downside capture ratios over 1 year, 3 years, and 5 years for the 70 international stock ETFs with at least 5 years of operating history and at least $50 million of net assets (plus SPY representing the S&P 500 for the United States).
Actionable Idea:
After evaluating capture ratios for various periods, own those ETFs with best upside capture when benchmarks turn up. Switch to ETFs with best downside capture ratios when benchmarks turn down.
Difficulties With The Idea:
The approach is easier to describe than do, because their are more issues to consider than just the ratios in the table; and because distinguishing between corrections and bulls or bears is a subjective matter for most people, with significant whipsaw risk.
The factors present in those ETFs that caused the capture ratios in the past may not be the same ones that will cause similar capture ratios in the future.
Different historical time periods present different capture ratios for individual securities, complicating judgment about which security is likely to be a better performer in the next cycle.
At a minimum, it would be a good idea to take this data into consideration, and then think through what ought to be the basis of capture ratios in the next up or down market, and make choices (to act or do nothing) with that understanding as background.
Suitability:
Suitable for accounts with investment experience and active management as part of their approach or advisor mandate; and which believe that technical factors can in fact reasonably detect changes in benchmark trend direction; and when daily vigilance is possible and likely.
This approach is not suitable for those accounts that do not consider technical analysis, or that do not make daily observations of the relevant data, or that do not believe in or wish to practice tactical portfolio repositioning.
Data Description:
The benchmark for the international funds is MSCI EAFE (SPY has the S&P 500 as its benchmark).
The capture ratios for each period and each direction are color coded from red to green through yellow and shades in between to represent worst (red) and best (green).
The table is sorted according to 5-year downside capture (on the assumption that readers might be most interested in the data that covered the 2008 crash). That 5-years also encompasses the full period so far of the European debt crisis since Greece emerged as the canary in the coal mine 3 years ago.
The EAFE index ETF (EFA) is shown in bold text with cells outlined. As it should be, EFA is in the middle of the list, because it is supposed to have unity with the benchmark, except for tracking error and fund expense drag.
ETFs that are close to the EFA position in the table with yellowish shading, have tended to perform about the same as EFA. The ETFs near the top and bottom of the table (and shaded in the darkest red or green) have performance that is significantly different from that of EFA based on the 5-year downside capture sort order.
Standout ETFs:
The six ETFs that are located +/- three positions either side of EFA are:
- EZA: iShares MSCI South Africa
- DOL: Wisdom Tree International LargeCap Dividend
- GWL: SPDR S&P World ex-US
- DWM: WisdomTree DEFA
- DIM: WisdomTree International MidCap Dividend
- SPY: SPDR S&P 500
The five ETFs with the least participation in the 5-year downside of MSCI EAFE are:
- DFJ: WisdomTree Japan SmallCap Dividend
- EWM: iShares MSCI Malaysia
- JSC: SPDR Russell/Nomura SmallCap Japan
- DXJ: WisdomTree Japan Hedged Equity
- EWJ: iShares MSCI Japan
The five ETFs with the greatest downside participation (actually a multiple of the downside of the benchmark) are:
- RSX: Market Vectors Russia
- EWO: iShares MSCI Austria Investable Market
- EWI: iShares MSCI Italy
- GUR: SPDR S&P Emerging Europe
- EWP: iShares S&P Spain
