Summary: Today we take another look at the US economy. The indicators paint a clear picture of an economy slowing, vulnerable to recession, in a strange space. A recession could become ugly; don’t expect a return to normality. {1st of 2 posts today.}
Contents
- The big trends
- My favorite indicator, a window onto the world
- Waiting for the return to normalcy
- For More Information
(1) The Big Trends
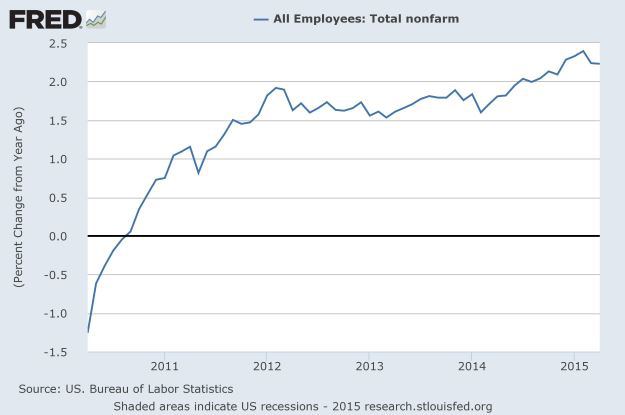
The bears say that we’re in a recession. But then they so often say that, at least since the crash. Let’s look at the data. The picture shows bad news — for those earning their bread by telling you lurid stories about the economy. Let’s look at a typical graph: the percent change year-over-year in non-farm jobs, not seasonally adjusted (not needed, since we’re using YoY numbers). It shows boring slow growth. The opposite of clickbait.
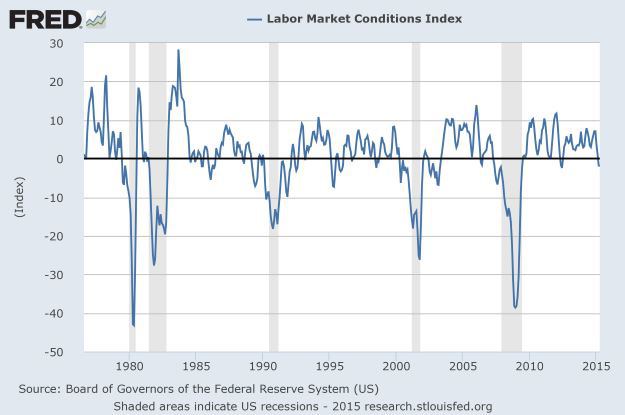
The number of jobs provides too narrow a window on the labor market to tell us much. For a wider view we can turn to the Fed’s Labor Market Conditions Index, combining 19 indicators in a complex model. An exciting reading of -2, until you realize that zero is the average. It shows slowing — as many indicators do now, but the data doesn’t justify the Zero Hedge headlines saying that we’re in recession.
For a broader perspective on the US economy, see the Big Four Economic Indicators graph at Advisor Perspective, showing the trend in the 4 key inputs to GDP. See the GDPnow page at the Atlanta Fed for the trend in the current quarter’s GDP — the economy reduced to a single number. This was an obscure indicator when I first mentioned it; now every twitch generates a thousand tweets. Mostly bogus tweets.
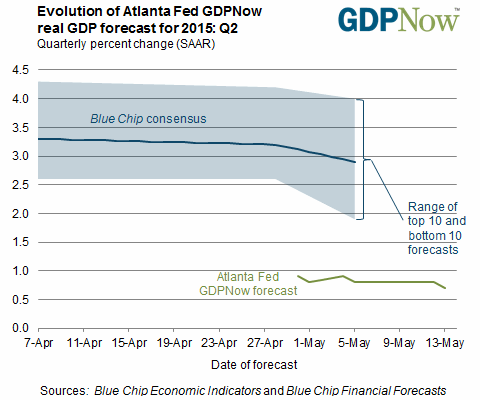
This looks ugly! The smart computer forecasts Q2 GDP at 0.7% growth while the stupid economists expect 3% (these are seasonally adjusted annualized rates). But the Fed tells us that results “do not give compelling evidence that the model is more accurate than professional forecasters.” So the most interesting aspect of this graph is the gap between the forecasts of economists and the model. Last quarter had a similar gap, with the model’s forecast proving spot on. This means something, although I don’t know what.
(2) My favorite indicator, a window onto the world
Due to the lag in the flow of economic data we know only where we were several months ago. We have scattered clues about where we are now from the few high frequency indicators. For a better view we can turn to leading indicators, as they take data about the past and forecast where we’re headed. My favorite leading indicator is the OECD Composite Leading Indicator, which shows growth in the industrial nations as above or below average (the 100 level).
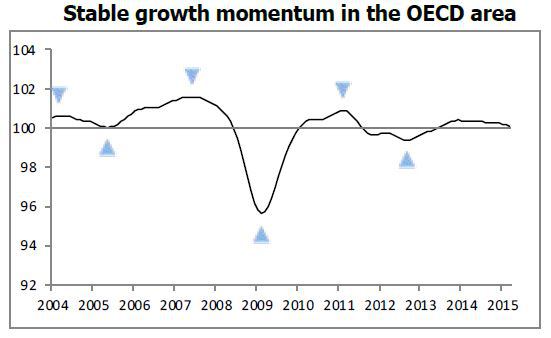
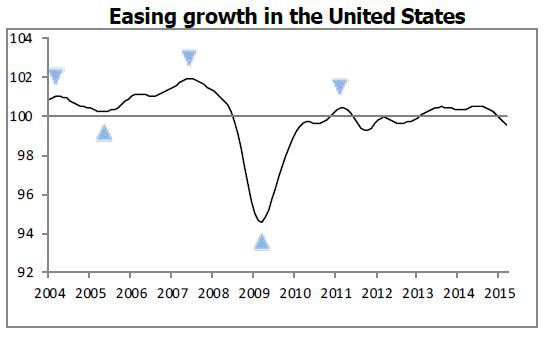
The striking aspect of this graph is the stability of growth since the crash, the result of active and so far successful economic stimulus programs. Faster growth would be good, but stability provides the foundation for future growth.
On the other hand, the economy is slowing. That seldom suffices to create a recession without some sort of shock pushing it into recession. But we’re vulnerable. Rising interest rates, increased oil prices, a recession in China — any of these or other shocks could do it. The effects of a recession under these circumstances would be difficult to predict, and could be ugly.
(3) Waiting for the return to normalcy
Since the crash economic data has been anomalies. Many economic metrics are far outside their ranges in the post-WWII era, such as interest rates, Fed assets, and M2 velocity. Others have hit record lows, such as the Baltic Dry Freight Index of shipping rates on bulk cargo (e.g., coal, iron ore), which in February was the lowest since records began in 1985, and the Shanghai Containerized Freight Index (SCFI). Others behave oddly for a recovery, such as the Civilian Labor Force Participation Rate since 2000 falling to lose half of its 1964-2000 rise.
Oddities abound, for which economists have many but unconvincing explanations.
What indicators will show when we’ve returned to Kansas? My favorite indicator for that purpose is M2 velocity, the ratio of nominal GDP to M2 money stock. It shows the speed of money coursing through the economy. It peaked in late 1997, near the end of Greenspan boom. Since late 2013 it has been falling at ~2%/year (quite rapidly by pre-crash standards), now at record lows. Eventually it will stabilize and trace out a new range — showing that the current phase has ended.
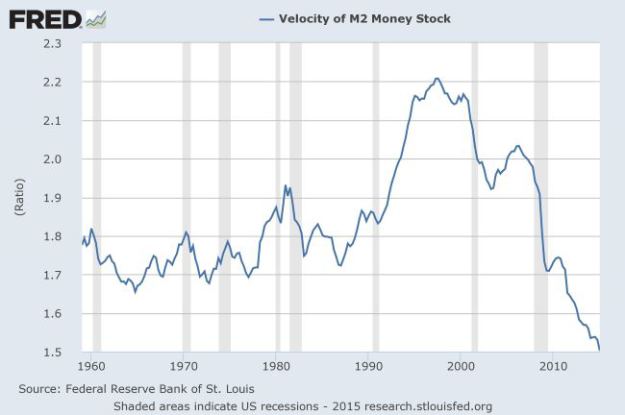
When will conditions return to normal? I do not believe they will. The world economy has broken away from the post-WWII regime into a transitional period before we begin a new normal. I do not believe we can do more than guess at what lies ahead.
