The United Kingdom has been one of the best performing economies in Europe and has recently seen a raft of data to back this up. A couple of indicators have shown a slowdown in the rate of growth, however these may just be minor hiccups. The pound is certainly looking like a good long term play, however, maybe not against the dollar. Traders will find a better long term play elsewhere.
Inflation
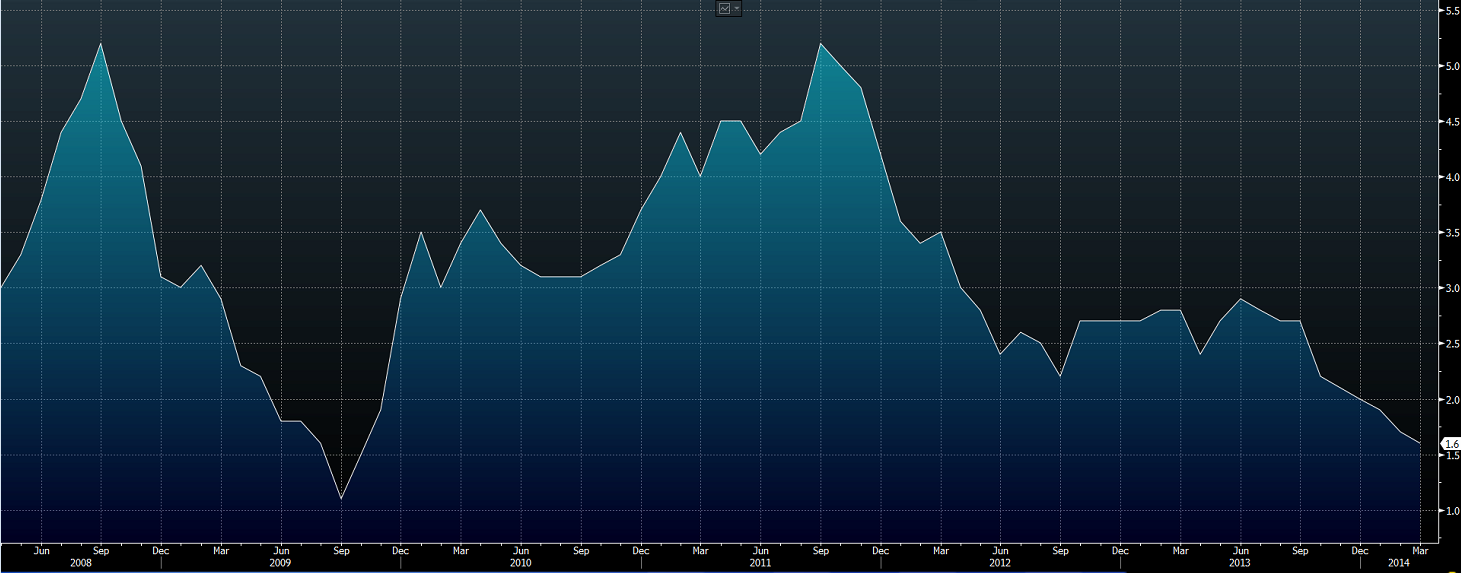
The most recent data out of the UK shows CPI growing at 1.6% annually. This is the first time since this index started to be tracked that the index has dropped for six consecutive months. 1.6% also represents a four year low for the index. The PPI also slowed, expanding at 0.2% for the month. Both of these figures have taken a slight turn for the worse in recent months but that will not bother policy makers in the UK too much. The steadiness in the CPI has given the Bank of England (BoE) a lot of breathing space when it comes to its Monetary Policy Committee (MPC), the board that sets interest rates. The MPC has kept interest rates on hold at 0.50% and these figures show they were right to do so.
UK Inflation 2008 – 2014
Employment
Wage inflation data is hot off the press and shows total average wages rose at 1.7% compared to a year earlier. This means that wages are increasing faster than inflation for the first time since 2009. This is a good indicator of the health and strength of the UK economy and means the average British worker will feel more prosperous.
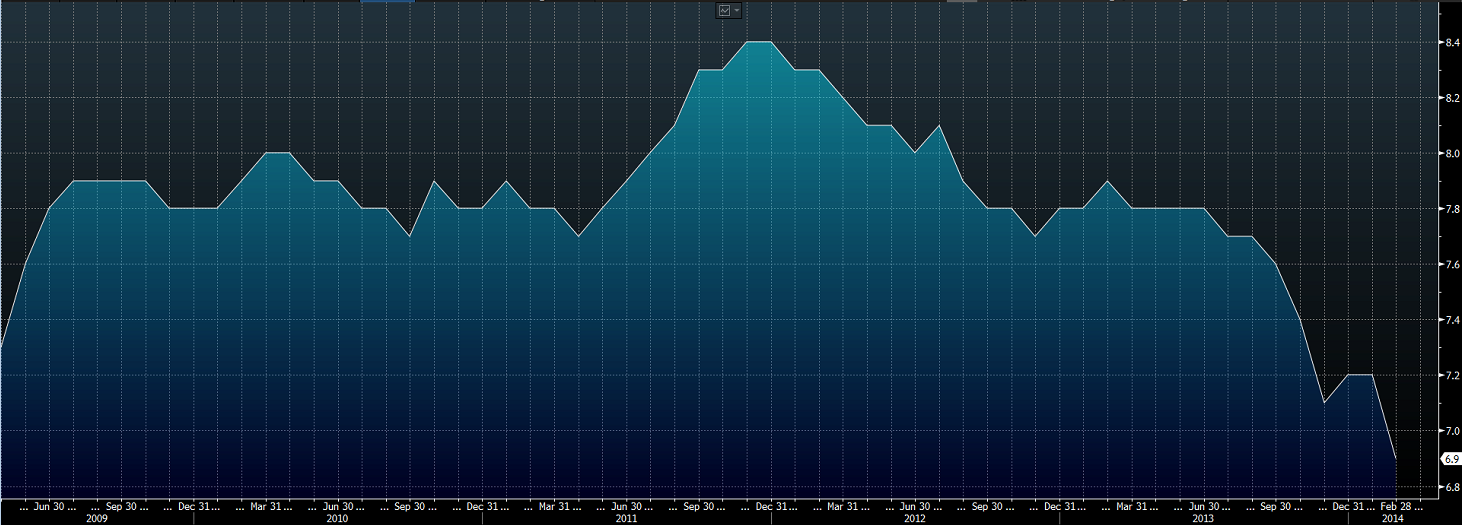
Unemployment has also provided more reasons to be confident in the UK economy. The market had predicted Unemployment to remain unchanged from a month earlier at 7.2%, however, investors were pleasantly surprised when the figure came in at 6.9%. This is a very good result for policy makers in the UK and show what they are doing is certainly helping the recovery. Unemployment has steadily fallen (with the odd hiccup) since it peaked in January-March 2012 at 8.4%
UK Unemployment 2009 – 2014
GDP
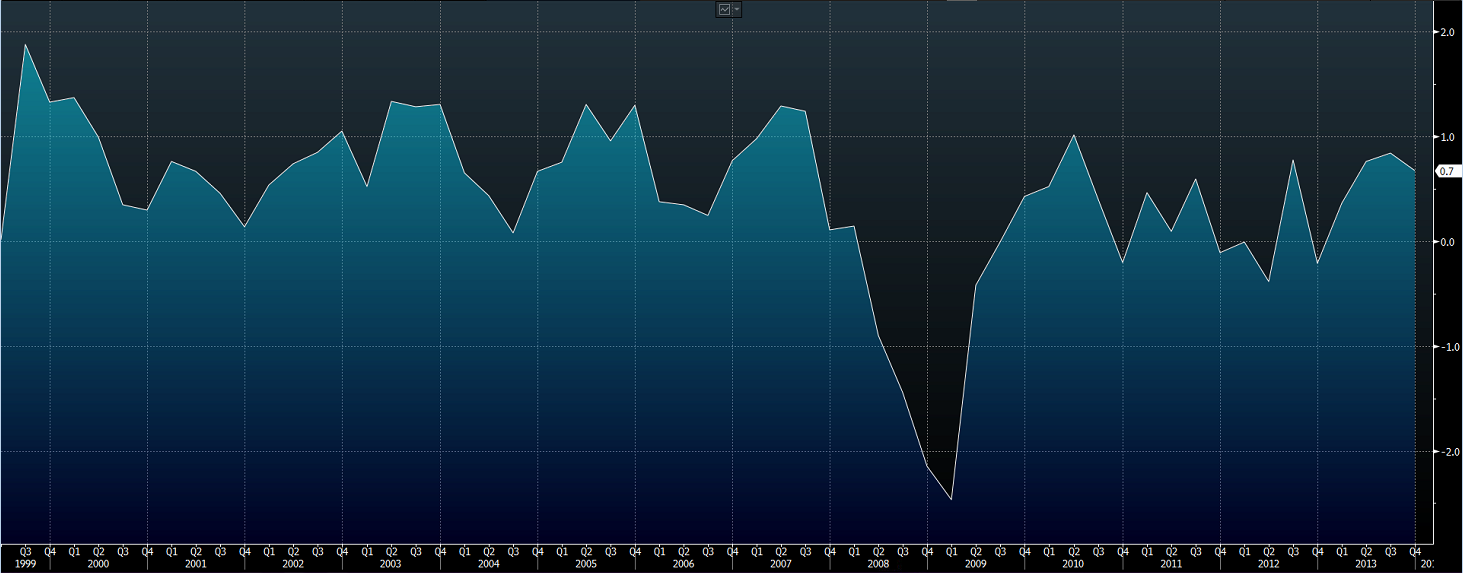
The UK economy is living up to its expectation as one of the power houses in Europe. The International Monetary Fund has said the UK economy would be the fastest-growing in the G7 this year.It predicted the UK economy would grow by 2.9% in 2014, up from its previous estimate of 2.4%, and will see growth of 2.5% next year. The most recent figures show GDP for the final quarter of 2013 expanding at 0.7% compared with the previous quarter and 2.7% compared with a year earlier so the IMF is justified in having these expectations.
UK GDP 1999 – 2013
The UK Service sector, which makes up 77.8% of the UK GDP, has had a solid start to the year. Exports from the service sector hit an all-time high and the most recent PMI showed expansion at 57.6. This is a good result, however, there is an underlying trend here and is along the same lines as the CPI, that is: declining growth. The Services PMI hit a high in November of 62.5, since then, however, it has had 5 straight months of disappointing results. So the sector is still expanding, remaining firmly planted above the 50.0 mark, albeit at a slower pace.
Monetary Policy
Monetary policy in the United Kingdom has remained stable for the past 4 years at 0.5%. With inflation posing no real threat to the UK economy, the BoE can maintain these historically low rates as a tool to boost economic activity.There is no need for the BoE to begin raising rates in the short-medium term and the expectations of the market are for rates to begin to rise in the first half of next year. This will depend of a myriad of indicators but CPI and Unemployment will be at the top of the list. The BoE has said previously that unemployment below 7% would be a trigger to begin raising rates but ultimately, went back on this statement as GDP and CPI figures showed reasons to keep rates on ice. More recently, Unemployment drifting up and CPI drifting lower will add weight to the arguments of the more dovish-leaning members of the MPC, so do not expect a raise in rates any time soon.
The Bank of England has also held its Quantitative Easing (QE) programme steady with a total of £375 billion worth of assets being held. There is no talk of this being expanded and it is unlikely, given that the economy is expanding. Will these assets ever be sold back to the market? Some in the market expect the BoE to never unwind and for good reason. Governor Mark Carney has said: “Any unwinding of QE should come after several adjustments to rates”. This means the BoE will sit on these assets for at least 18 months and even when things are looking rosy, there will be little pressure to sell.
Technicals
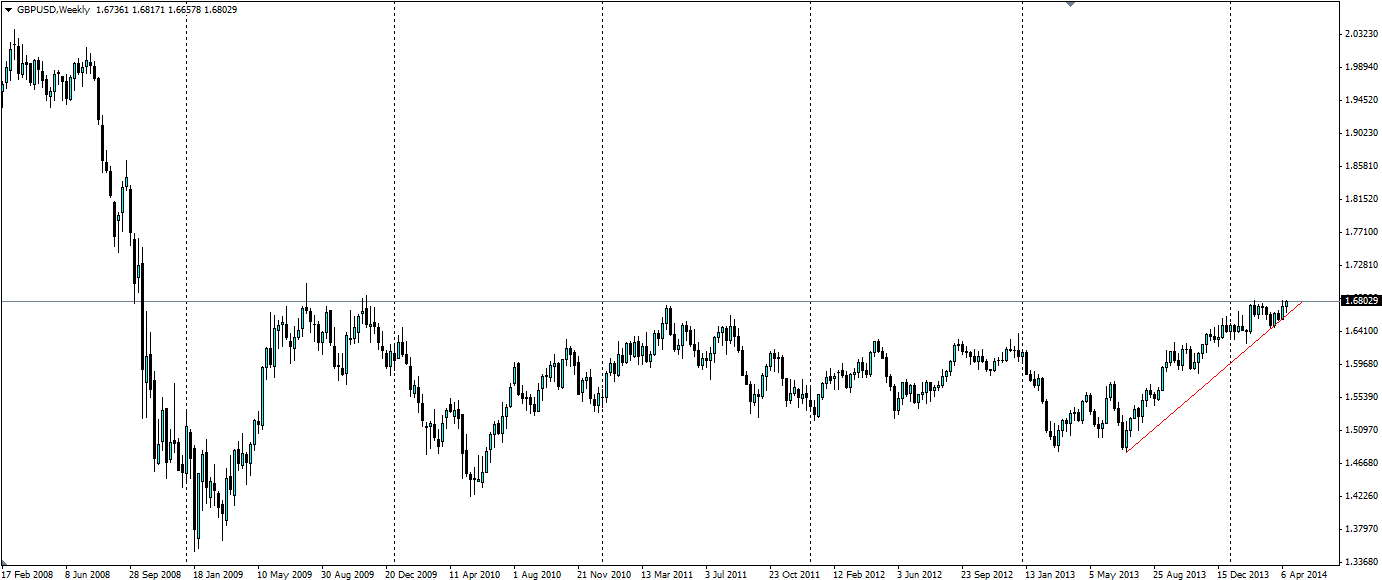
The most obvious thing to see on the GBP/USD daily chart is the bullish trend line stretching back to August 2013. This trend has been tested on numerous occasions and has held on all of them. This trend should continue in the short-medium term as more data backs up the momentum in the recovery. If any more data shows the momentum slowing, then this trend could be seriously tested.
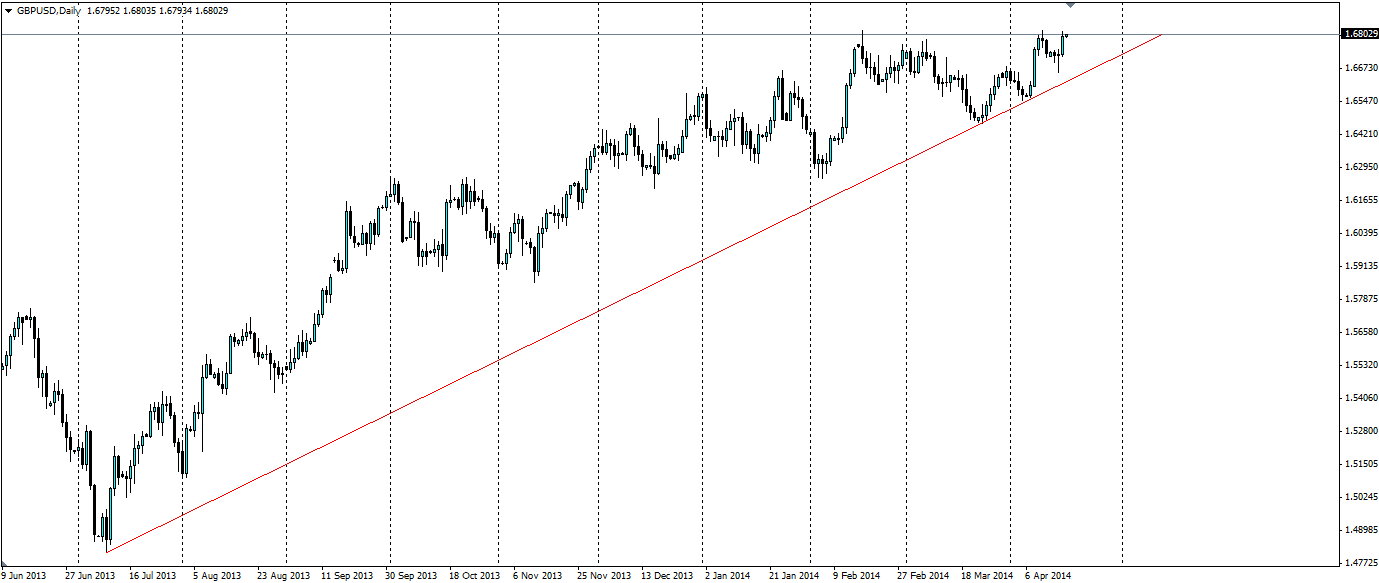
In the long term, however, the story will be different. The US is looking to end their QE program by August this year and will begin lifting interest rates “six months after that” according to FED chair Janet Yellen. This will no doubt add strength to the Dollar in the long term and any signs that this could come earlier will likely lead to the GBPUSD trend being rendered invalid. At the moment, the price is a shade over 1.6800 and this level has been tested several times over the past 5 years without a significant break over it. The resistance at 1.6822 appears to be holding and we need to go back to 2008 for the last time it was over this level for a significant period of time.
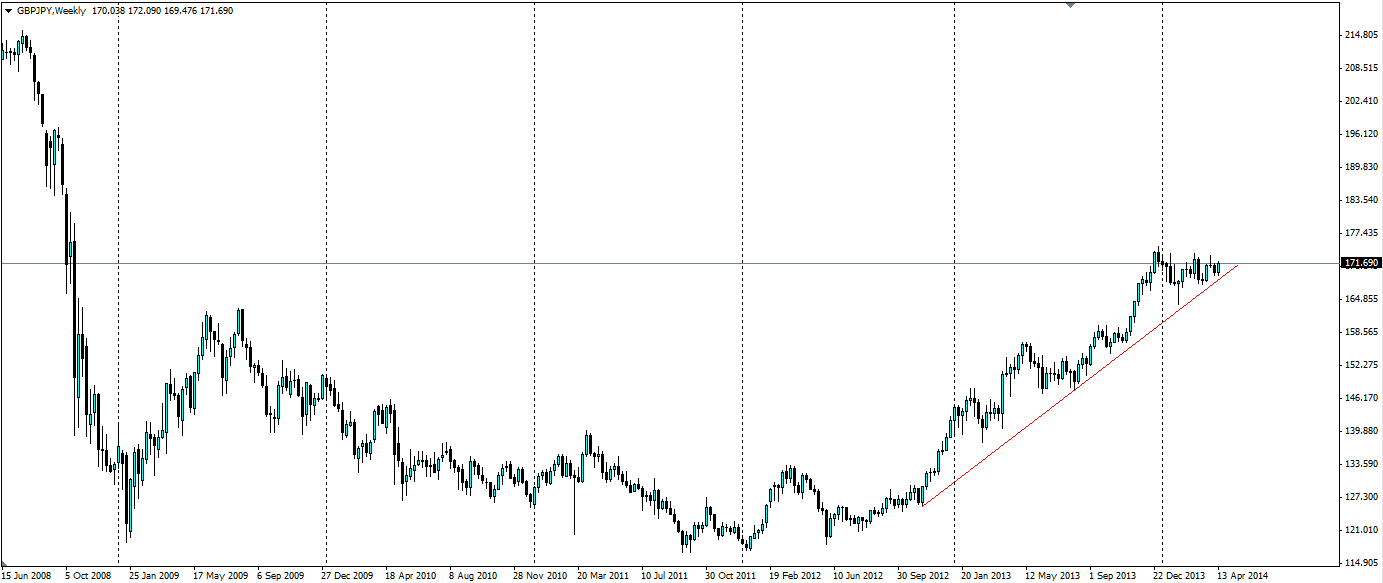
A better long term play for a bullish Pound will be against the Yen. The GBP/JPY charts show a similar bullish trend but the fundamentals are in favour of a weaker Yen, given that the Bank of Japan is looking to add to its QE programme by mid-2014. This cross pair is close to the historical resistance at 174.83, however, it is playing off a bullish trend that began back at the start of 2012 whereas the GBPUSD trend began in the middle of 2013, so the GBPJPY trend should be more robust. Furthermore it has the fundamentals to back up a bullish Pound and a bearish Yen.
Summary
The most recent economic data out of the UK shows a robust recovery is underway. Some data points to a slowdown in the rate of growth, however, this may just be a minor speed bump in a road paved with solid fundamentals. The Pound should see some good returns against the Dollar in the medium term, however, this will depend on the Monetary Policy outlook for the US, therefore the Pound should fare better against the Yen, given the likelihood of more stimulus from the Bank of Japan.
