Ubiquiti Networks, Inc. (UBNT) designs, manufactures and sells broadband wireless solutions worldwide. The Company offers a portfolio of wireless networking products and solutions, including systems, high performance radios, antennas and management tools, designed for wireless networking and other applications in the unlicensed radio frequency (RF) spectrum.
This is a vol note in a dipping stock which has recently (in the last year) gone public. After doing a little reading, I found the controversy surrounding it quite interesting. I’ll include some snippets below from a CNBC article written by Herb Greenberg, but I recommend reading the entire post.
Since coming public in October, it is one of the lesser-known (not to mention controversial) boom/busts of the IPO class of 2011. After more than doubling since going public, in the past month it has lost more than half its value amid concerns of slowing growth and more controversy.
The controversy started in its IPO prospectus, where the company conceded that some of its networking products had been shipped to Iran (which is banned by the U.S.) without its knowledge “by third parties.”
The Iran issue has plagued the company since, with Ubiquiti Networks Inc blaming a former Middle Eastern distributor for making the sales. In his own blog, the distributor — who has been sued by the company for not paying his bills — has claimed the company knew about the sales to Iran.
There also are questions swirling around legal issues in South America surrounding one of its largest distributors.
And in the past month or so there were reports circulating that the company had ties to the Chinese mafia — which, according to Forbes, Ubiquiti CEO Robert Pera denied in an internal memo. -- Source: CNBC via Yahoo! Finance; Why Ubiquiti Networks Is So Controversial.
So we’re talking illegal sales to Iran, legal issues in South Africa and a potential (unconfirmed) connection to the Chinese Mafia. Having said all of that, the stock is down for more tangible reasons. I’ve included more of the article, below.
Strip all of that way and there is the thing that counts most — its business, which CFO John Ritchie has described as selling “ high-performance communication platforms to developing emerging markets and underserved and underpenetrated markets.”
On the surface, even with growth showing signs of slowing, it looks like a winner: Fast-growing sales and earnings.
Tech-focused Saratoga Research, which has had a long-term sell on the company, has focused on several earnings quality issues, including:
The company’s reliance on selling to distributors, rather than to the end customer. Most of Ubiquiti’s sales go through distributors, with two distributors accounting for this “sell-in” method, which is considered aggressive and rarely used by hardware companies. Among the concerns: That it could lead to channel stuffing.
An increase in account receivable days outstanding in recent months. Over the past few quarters they’ve been increasing. On last quarter’s earnings call the company blamed the increase on a number of things, including factory shutdowns in China associated with the Chinese New Year leading to a quarter that was more “back-end loaded.”
Ritchie hasn’t returned my call, but this is clear: Back-end loaded combined with recognizing revenue on the sale into distributors is always a red flag.
ANALYSIS
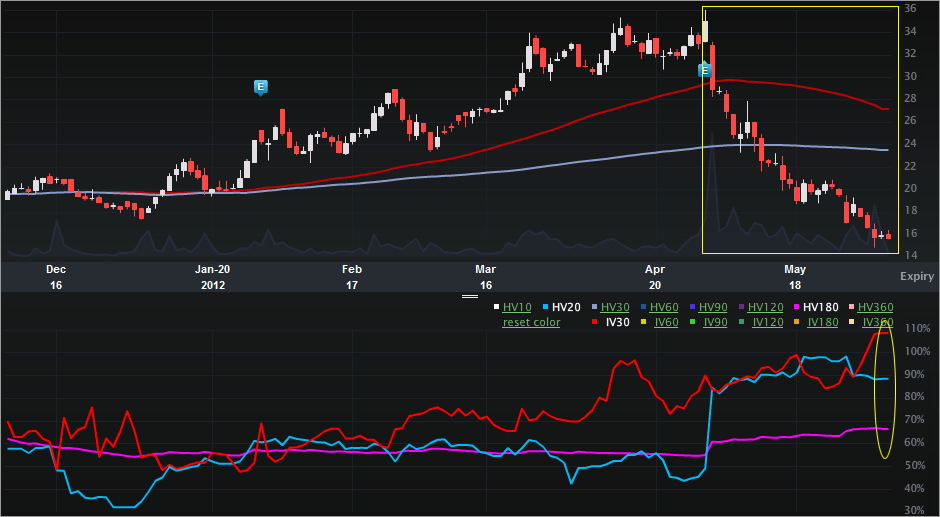
Let’s turn to the Charts Tab (six months), below. The top portion is the stock price, the bottom is the vol (IV30™ - red vs HV20™ - blue vs HV180™ - pink).
On the stock side, I’ve highlighted the recent drop. There was an initial drop off of earnings, but even after that first abrupt move, the stock has continued to fall. The 52 wk range is [$14.83, $35.99], so the current price is nearing that all-time low.
On the vol side we can see how elevated the implied is relative to the two historical realized vol measures.
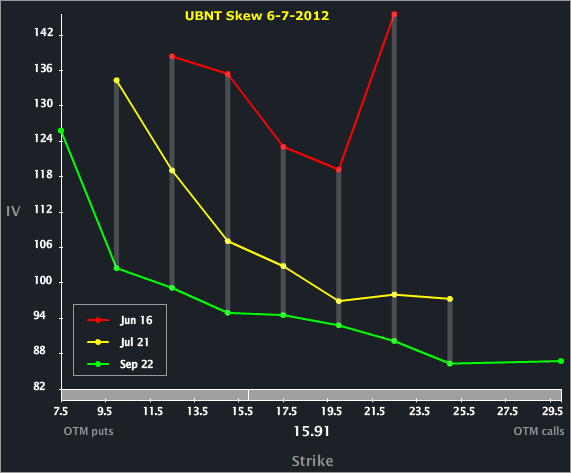
Let’s turn to the Skew Tab to examine the month-to-month and line-by-line vols.
We can see a rising vol from the back to the front expiries. I do find it a little odd that the front month is so elevated to the second. Obviously we’re close to expo, but it almost feels like the options reflect a volatility event in the next seven trading days (i.e. inside Jun expo). I don’t have any hard evidence of that, though.
SUMMARY
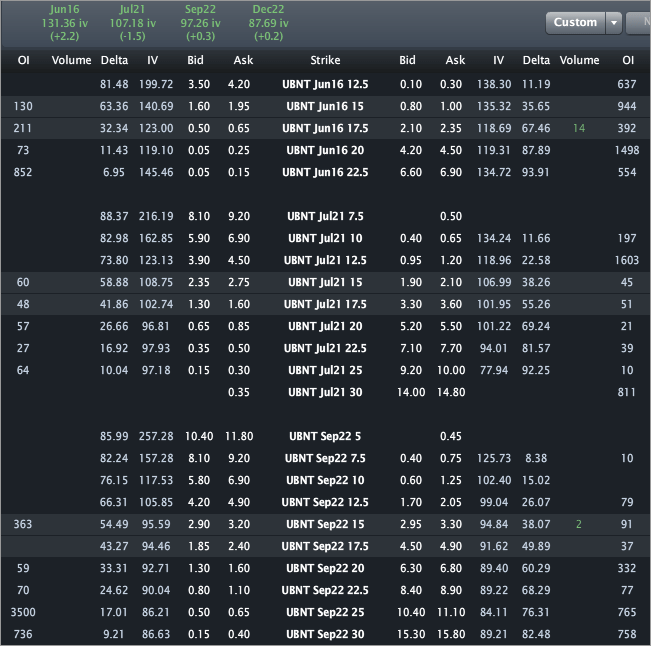
Finally, let’s turn to the Options Tab for completeness.
I wrote about this one for TheStreet (OptionsProfits), so no specific trade analysis here. Across the top we can see the monthly vols are 131.36%, 107.18% and 97.26% for Jun, Jul and Sep.
My general feeling about vol is that even though it’s at (or near) an all-time high, it could go higher. Maybe we could so far as to say it should be higher? I dunno... All the research I've down is simply read a CNBC article and look over some vol charts. Whatever the case, a position in this name feels like a pure spec trade, certainly not an investment.
Disclaimer: This is trade analysis, not a recommendation.
- English (UK)
- English (India)
- English (Canada)
- English (Australia)
- English (South Africa)
- English (Philippines)
- English (Nigeria)
- Deutsch
- Español (España)
- Español (México)
- Français
- Italiano
- Nederlands
- Português (Portugal)
- Polski
- Português (Brasil)
- Русский
- Türkçe
- العربية
- Ελληνικά
- Svenska
- Suomi
- עברית
- 日本語
- 한국어
- 简体中文
- 繁體中文
- Bahasa Indonesia
- Bahasa Melayu
- ไทย
- Tiếng Việt
- हिंदी
UBNT: Stock Collapsing. Illegal Actions Aren't The Issue, Or Are They?
Published 06/08/2012, 03:51 AM
Updated 07/09/2023, 06:31 AM
UBNT: Stock Collapsing. Illegal Actions Aren't The Issue, Or Are They?
3rd party Ad. Not an offer or recommendation by Investing.com. See disclosure here or
remove ads
.
Latest comments
Install Our App
Risk Disclosure: Trading in financial instruments and/or cryptocurrencies involves high risks including the risk of losing some, or all, of your investment amount, and may not be suitable for all investors. Prices of cryptocurrencies are extremely volatile and may be affected by external factors such as financial, regulatory or political events. Trading on margin increases the financial risks.
Before deciding to trade in financial instrument or cryptocurrencies you should be fully informed of the risks and costs associated with trading the financial markets, carefully consider your investment objectives, level of experience, and risk appetite, and seek professional advice where needed.
Fusion Media would like to remind you that the data contained in this website is not necessarily real-time nor accurate. The data and prices on the website are not necessarily provided by any market or exchange, but may be provided by market makers, and so prices may not be accurate and may differ from the actual price at any given market, meaning prices are indicative and not appropriate for trading purposes. Fusion Media and any provider of the data contained in this website will not accept liability for any loss or damage as a result of your trading, or your reliance on the information contained within this website.
It is prohibited to use, store, reproduce, display, modify, transmit or distribute the data contained in this website without the explicit prior written permission of Fusion Media and/or the data provider. All intellectual property rights are reserved by the providers and/or the exchange providing the data contained in this website.
Fusion Media may be compensated by the advertisers that appear on the website, based on your interaction with the advertisements or advertisers.
© 2007-2024 - Fusion Media Limited. All Rights Reserved.
