
U.S. Bancorp (NYSE:USB) reported a positive surprise of 2.5% in the second quarter of 2016. The company reported earnings per share of 83 cents, beating the Zacks Consensus Estimate by 2 cents. Results also exceeded the prior-year quarter earnings of 80 cents.
Excluding non-recurring items related to equity investments, legal and regulatory matters and charitable contributions, earnings per share came in at 82 cents.
Shares of U.S. Bancorp increased more than 1% in the pre-market session, indicating that investors have been bullish on the results. The price reaction during the full trading session will give a fair idea about the extent of satisfaction among investors.
Organic growth was driven by higher revenues along with elevated average loans and deposits. Steady capital deployment activities reflected a strong capital position. However, increase in expenses and provisions were a major drag.
Net Income was $1.5 billion, up 2.7% year over year.
Revenue Surges, Higher Costs & Provisions
U.S. Bancorp’s net revenue came in at around $5.4 billion in the quarter, up 8.1% year over year. The increases in net interest income as well as non-interest income were the tailwinds. Moreover, revenues outpaced the Zacks Consensus Estimate of $5.2 billion.
U.S. Bancorp’s tax-equivalent net interest income was $2.9 billion in the quarter, up 4.5% from the prior-year quarter. The rise was mainly due to loan growth and higher rates. These positives were partially offset by a continued shift in the loan portfolio mix.
Average earning assets climbed 5.2% year over year, driven by growth in average total loans and average investment securities. Yet, net interest margin of 3.02% was down 1 basis point year over year and primarily reflected lower rates on new securities along with reduced reinvestment rates on maturing securities, partially offset by higher rates on loans.
U.S. Bancorp’s non-interest income jumped 12.3% on a year-over-year basis to $2.6 billion. The upsurge was mainly due to an increase in almost all components of non-interest income.
Provision for credit losses increased 16.4% year over year to $327 million in the reported quarter.
U.S. Bancorp’s average total loans increased 8.1% year over year to $266.6 billion. The growth was driven by a rise in commercial loans, total commercial real estate, residential mortgages and credit card loans. These increases were partially offset by a drop in retail leasing and covered loans. Excluding covered loans, average total loans rose 8.6% year over year.
Average total deposits were up 7.6% from the prior-year quarter to $307.4 billion. The rise was due to growth in non-interest-bearing deposits, savings deposits as well as interest-bearing deposits.
Non-interest expenses rose 11.6% year over year to $3.0 billion at U.S. Bancorp. Elevated compensation, professional services, marketing and business development and technology and communications expenses played spoilsport. These were partially offset by lower employee benefits along with net occupancy and equipment expenses.
Deteriorating Credit Quality
Credit metrics at U.S. Bancorp deteriorated in the reported quarter. Net charge-offs were $317 million, up 7.1% year over year. On a year-over-year basis, the company experienced deterioration in net charge-offs in the commercial segment.
Total allowance for credit losses was $4.3 billion, slightly up on a year-over-year basis. U.S. Bancorp’s non-performing assets (excluding covered assets) were $1.6 billion, up 6.7% year over year.
Strong Capital Position
During the quarter under review, U.S. Bancorp maintained a solid capital position. Effective Jan 1, 2014, the regulatory capital requirements for the company comply with Basel III, subject to certain transition provisions from Basel I over the next four years to full implementation by Jan 1, 2018.
The tier 1 capital ratio was 11.1% compared with 11.0% in the prior-year quarter. Common equity tier 1 capital to risk-weighted assets ratio under the Basel III standardized approach fully implemented was 9.5% as of Jun 30, 2016, in line with the prior-year quarter.
All regulatory ratios of U.S. Bancorp continued to be in excess of “well-capitalized” requirements. Moreover, based on the Basel III fully implemented advanced approach, the Tier 1 common equity to risk-weighted assets ratio was estimated at 12% as of Jun 30, 2016, compared with 12.4% as of Jun 30, 2015. The common equity tier 1 capital to risk-weighted assets ratio under the Basel III standardized approach fully implemented was 9.3% as of Jun 30, 2016, compared with 9.2% as of Jun 30, 2015.
The tangible common equity to tangible assets ratio was 7.6% as of Jun 30, 2016, compared with 7.5% as of Jun 30, 2015.
U.S. Bancorp posted an improvement in book value per share, which increased to $24.37 as of Jun 30, 2016, from $22.51 recorded at the end of the prior-year quarter.
Capital Deployment Update
Reflecting the company’s capital strength during the second quarter, U.S. Bancorp returned 77% of earnings to its shareholders through common stock dividends and buybacks. It was at the high end of the company’s long-term goal of returning 60%–80% to its shareholders.
Conclusion
U.S. Bancorp posted an encouraging quarter. Along with higher revenues, a solid capital position and increased lending activities were the added advantages. The company follows a conservative growth stratagem and has made small but strategic acquisitions.
However, the weakness in the energy sector continued to negatively affect the company’s asset quality. Moreover, there are concerns related to the impact of legal issues and its global exposure. Also, rising expenses along with provisions remain headwinds.
US BANCORP Price, Consensus and EPS Surprise
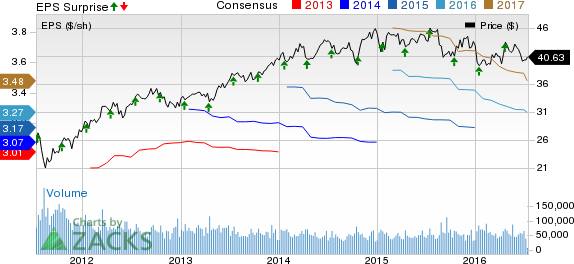
US BANCORP Price, Consensus and EPS Surprise | US BANCORP Quote
The shares of U.S. Bancorp currently carry a Zacks Rank #4 (Sell).
Performance of Other Major Banks
Meanwhile, banking major – JPMorgan Chase & Co. (NYSE:JPM) – which kicked started the second-quarter earnings, driven by improved trading revenues, reported earnings of $1.55 per share, neatly outpacing the Zacks Consensus Estimate of $1.43. Also, the figure reflects a 1% rise from the year-ago period. Notably, the results included a legal benefit of $430 million.
Among other Wall Street giants, Bank of America Corporation (NYSE:BAC) is scheduled to report second-quarter 2016 earnings on Jul 18, while Comerica Incorporated (NYSE:CMA) will report on Jul 19.
Want the latest recommendations from Zacks Investment Research? Today, you can download 7 Best Stocks for the Next 30 Days. Click to get this free report >>
JPMORGAN CHASE (JPM): Free Stock Analysis Report
COMERICA INC (CMA): Free Stock Analysis Report
US BANCORP (USB): Free Stock Analysis Report
BANK OF AMER CP (BAC): Free Stock Analysis Report
Original post
Zacks Investment Research