
Tyson Foods, Inc. (NYSE:TSN) posted third-quarter fiscal 2016 results, wherein both earnings and revenues beat the Zacks Consensus Estimate.
In the fiscal third quarter, adjusted earnings of $1.21 per share surpassed the Zacks Consensus Estimate of $1.07 by 13.08% and improved 51% from the year-ago tally of 80 cents on higher margins.
Revenues and Margins
Net sales gained 6.6% to $9.403 billion due to higher sales across most of segments like chicken, beef, pork and prepared foods segments. Sales outpaced our expectation of $9.23 billion by 1.8%. Sales volume dipped 2.7%, while average sales price (ASP) went down 4.1%.
TYSON FOODS A Price, Consensus and EPS Surprise
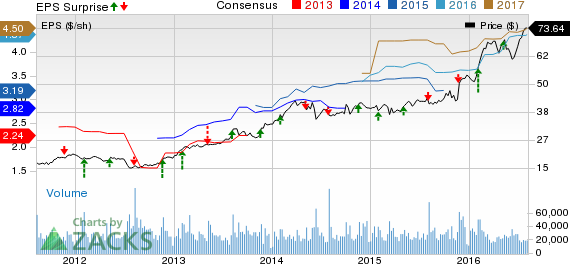
TYSON FOODS A Price, Consensus and EPS Surprise | TYSON FOODS A Quote
Tyson's adjusted operating income surged 35.03% to $767 million due to lower feed costs. Adjusted operating margin rose 260 basis points (bps) to 8.2%.
Segment Details
Chicken: Sales at this segment remained almost flat year over year at $2.74 billion as a 0.9% dip in sales volume was offset by a 0.4% reduction in average price. Sales volume declined due to company’s strategy of optimizing its mix. Average sales price increased in the fiscal third quarter on positive mix.
Beef: Sales at this segment declined 12.12% year over year to $3.78 billion, as 2.9% increase in sales volume was offset by a 14.6% decrease in average selling price (ASP). ASP declined due to higher domestic availability of fed cattle supplies, while sales volume was hurt by reduction in live cattle processed.
Pork: Pork segment sales were up 5.30% year over year to $1.27 billion as 1.7% increase in sales volume was offset by a 7.2% rise in average price.
Prepared Foods: Sales at Prepared Foods remained flat year over year at $1.80 billion as 1.9% gain in volume was offset by an equal decline in ASP. Adjusted sales volume grew on positive mix. Adjusted ASP slipped primarily due to a decline in input costs, partially offset by a change in product mix.
Other: In the fiscal first quarter, the company’s International segment was shifted under ‘Other’ following the sale of the Mexico and Brazil chicken operations in fiscal 2015. The Other segment also includes the foreign operations related to raising and processing live chickens in China and India and third-party merger and integration costs.
Sales nosedived to $99 million from $244 million in the year-ago quarter.
Fiscal 2016 Guidance
For fiscal 2016, Tyson maintains sales guidance at approximately $37 billion, lower than the year-ago level due to declines in beef, pork and feed prices.
The company expects an increase in overall domestic protein production (chicken, beef, pork and turkey) of roughly 2–3% year over year.
The company projects annual earnings in the range of $4.40–$4.50 per share compared with $4.20–$4.30 per share expected earlier.
Fiscal 2017 Guidance
The company issued fiscal 2017 guidance in concurrence with the earnings call. The company expects sales to inch up 1% as sales volume grow, partially offset by the impact of lower beef, pork and chicken prices. For fiscal 2017, the company expects domestic protein production (chicken, beef, pork and turkey) to increase approximately 2–3% from the fiscal 2016 levels. Tyson expects to realize synergies of approximately $700 million in fiscal 2017 from the acquisition.
Tyson carries a Zacks Rank #3 (Hold).
Some better-ranked stocks in the consumer staple sector include Omega Protein Corporation (NYSE:OME) , Post Holdings, Inc. (NYSE:POST) and Pinnacle Foods Inc. (NYSE:PF) . While Omega Protein sports a Zacks Rank #1 (Strong Buy), Post Holdings and Pinnacle Foods holds a Zacks Rank #2 (Buy).
TYSON FOODS A (TSN): Free Stock Analysis Report
OMEGA PROTEIN (OME): Free Stock Analysis Report
POST HOLDINGS (POST): Free Stock Analysis Report
PINNACLE FOODS (PF): Free Stock Analysis Report
Original post
Zacks Investment Research