Two Harbors Investment Corp. (TWO) operates as a real estate investment trust (REIT). The Company is focused on investing in, financing and managing residential mortgage-backed securities (RMBS), residential mortgage loans, residential real properties, and other financial assets.
This is a very quick vol and stock price note in a REIT that has beached an annual high in IV30™ and has been catapulting lower in stock price of late. Before we get into this specific name, here's some evergreen news on REIT's of late:
The Vanguard REIT ETF -- which tracks the performance of an index that measures the performance of publicly traded equity REITs -- has stalled after the Federal Reserve in September announced plans to purchase $40 billion in mortgage-backed securities a month. Five Star Equities examines the outlook for diversified REITs and provides equity research on Hatteras Financial Corp. (HTS) and Two Harbors Investment Corp. (TWO).
Investors have long been attracted to the high yields of mortgage REITs, which currently averages around 13 percent, nearly 7 times the average dividend yield of the S&P 500. The Fed's announcement has caused drops in spreads, bond yields and homeowner's borrowing costs, and as a result company's earnings and dividends have been under pressure.
"Through the use of leverage, these REITs have yields in the midteens. At this time, mortgage REITs are benefiting from historically low short-term rates, but tightening spreads, or a sudden freeze in the credit markets, would have a significant negative impact on these firms," Morningstar analyst Patricia Oey wrote in a report. -- Source: Five Star Equities via Yahoo! Finance; REITs Begin to Struggle as Stimulus Measures From the Federal Reserve Pressure Spreads and Bond Yields Lower.
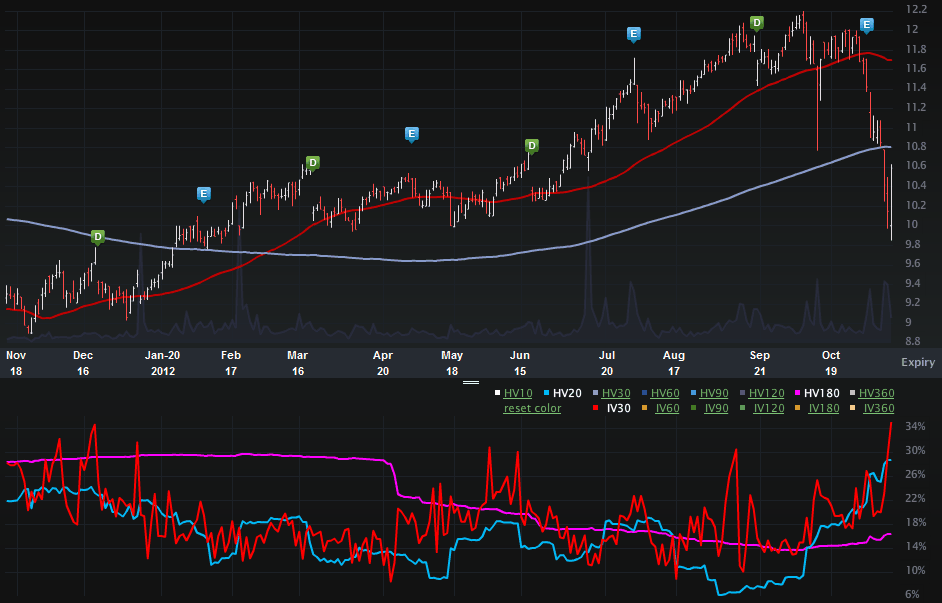
Let's look at the Charts Tab (one year) for TWO, below. The top portion is the stock price, the bottom is the vol (IV30™ - red vs HV20™ - blue vs HV180™ - pink).
On the stock side we can see how abruptly the stock has declined of late. On 10-25-2012 the stock closed at $11.97. As of this writing, the stock is down 11.4%, and keep in mind, the yield is likely in the single digits. The 52 wk range in stock price is [$7.66, $12.20].
On the vol side we can see how the implied has spiked of late, in particular today. The 52 wk range in IV30™ is [8.43%, 34.59%], so the level today is in fact a new annual high. Back in Sep of 2011, the implied actually rose into the high 50% range, so the level today is not a multi-year high.
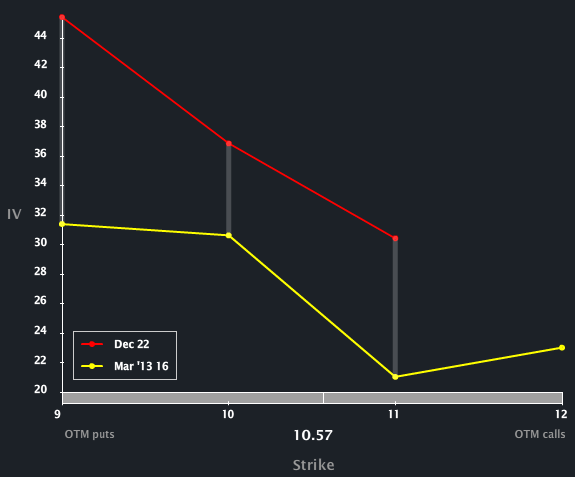
Let's turn to the Skew Tab, below.
We can see a notable vol diff between the Dec and Mar'13 options. The REIT systematic risk is certainly in play and the option market reflects that risk in the near-term rather substantially.
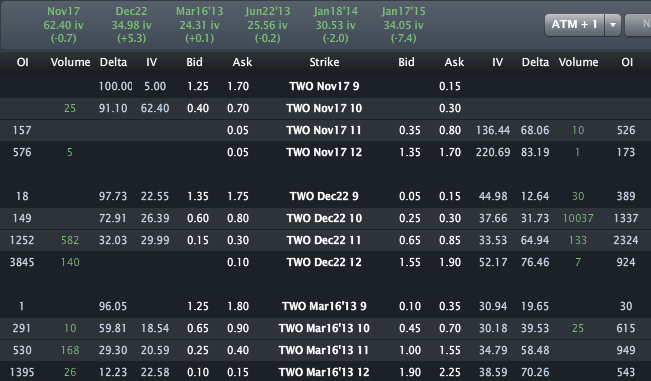
Finally, let's turn to the Options Tab.
Across the top we can see that Dec is priced to nearly 35% while Mar is priced to just 24.6%. In the REIT wold, this is a very large vol diff.
Disclosure: This is trade analysis, not a recommendation.
Images provided by Livevol®
- English (UK)
- English (India)
- English (Canada)
- English (Australia)
- English (South Africa)
- English (Philippines)
- English (Nigeria)
- Deutsch
- Español (España)
- Español (México)
- Français
- Italiano
- Nederlands
- Português (Portugal)
- Polski
- Português (Brasil)
- Русский
- Türkçe
- العربية
- Ελληνικά
- Svenska
- Suomi
- עברית
- 日本語
- 한국어
- 简体中文
- 繁體中文
- Bahasa Indonesia
- Bahasa Melayu
- ไทย
- Tiếng Việt
- हिंदी
Two Harbors: REIT Vol Breaches Annual High; Stock Dropping
Published 11/17/2012, 05:36 AM
Updated 07/09/2023, 06:31 AM
Two Harbors: REIT Vol Breaches Annual High; Stock Dropping
3rd party Ad. Not an offer or recommendation by Investing.com. See disclosure here or
remove ads
.
Latest comments
Install Our App
Risk Disclosure: Trading in financial instruments and/or cryptocurrencies involves high risks including the risk of losing some, or all, of your investment amount, and may not be suitable for all investors. Prices of cryptocurrencies are extremely volatile and may be affected by external factors such as financial, regulatory or political events. Trading on margin increases the financial risks.
Before deciding to trade in financial instrument or cryptocurrencies you should be fully informed of the risks and costs associated with trading the financial markets, carefully consider your investment objectives, level of experience, and risk appetite, and seek professional advice where needed.
Fusion Media would like to remind you that the data contained in this website is not necessarily real-time nor accurate. The data and prices on the website are not necessarily provided by any market or exchange, but may be provided by market makers, and so prices may not be accurate and may differ from the actual price at any given market, meaning prices are indicative and not appropriate for trading purposes. Fusion Media and any provider of the data contained in this website will not accept liability for any loss or damage as a result of your trading, or your reliance on the information contained within this website.
It is prohibited to use, store, reproduce, display, modify, transmit or distribute the data contained in this website without the explicit prior written permission of Fusion Media and/or the data provider. All intellectual property rights are reserved by the providers and/or the exchange providing the data contained in this website.
Fusion Media may be compensated by the advertisers that appear on the website, based on your interaction with the advertisements or advertisers.
© 2007-2024 - Fusion Media Limited. All Rights Reserved.
