The Hoot
Actionable ideas for the busy trader delivered daily right up front
- Tuesday lower.
- ES pivot 2061.08. Holding below is bearish.
- Rest of week bias lower technically.
- Monthly outlook: bias higher.
- YM futures trader: no trade.
Last night I wasn't ready to commit either way amid some signs that pointed to a move lower but weren't strong enough to be quite certain. Tonight we have a bit more clarity after a day the major averages all lost a bit of ground so we move directly to the charts to analyze the fallout for Tuesday.
The technicals
The Dow: Technically speaking (and this is after all a technical blog), on Monday the Dow looked quite bearish, with a tall red candle as a dark cloud cover that left indicators all overbought. Furthermore, the failure to break Friday's intraday high adds to the pessimism. Tuesday appears now to have more downside risk than upside potential.
The VIX: Despite a tall red marubozu as a bearish engulfing pattern last Friday the VIX gained nearly 8% on Monday. That completed the incipient bullish stochastic crossover I noted last night. The candle is now an inside harami so it's technically bullish at this point.
Market index futures: Tonight, all three futures are lower at 12:18 AM EDT with ES down 0.27%. On Monday ES put in a tall lopsided spinning toppish-harami-like thing that tested 2071 intraday but ultimately failed. With a new bearish stochastic crossover just completed and the overnight guiding lower, this chart now looks bearish.
ES daily pivot: Tonight the ES daily pivot rises again from 2055.75 to 2061.08. That now leaves ES below its new pivot so this indicator flips back to bearish.
Dollar index: After a bad Fed-induced week last week, the dollar found a modicum of support the past three days that continued on Monday with a modest 0.10% decline. Indicators are now extremely oversold and the stochastic is on the verge of a bullish crossover (%K=13, %D=14). So with three bullish reversal signs in a row now it looks like it's about time for the dollar to move higher.
Euro: And the euro was a mirror image of the dollar on Monday. It is now extremely overbought with RSI=100. Two doji stars in a row and a failure to make new intraday highs, make it look like the euro's going lower form here. This complements my idea that the dollar's going higher (I compose both sections independently).

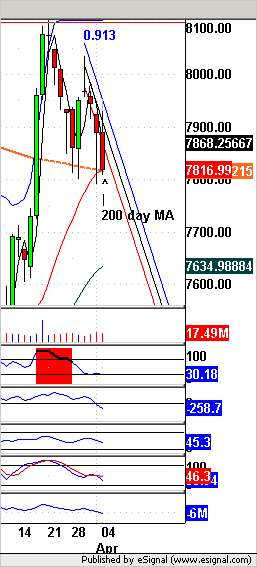
Transportation: Last night I noted a bearish divergence in the trans. That was confirmed on Monday with an early one percent drop, their worst showing since March 8th in a dump that stopped exactly on their 200 day MA. Note how last week's gravestone doji provided the top and the exponential rundown since then. With three successful tests of the MA in the last week and indicators nearly oversold, it will be interesting to see if the trans manage to bounce off the MA or fall on through on Tuesday.

Monday's action provided the clarity I was missing on Sunday night. With some reversal signs now confirmed, I'm going to call Tuesday lower.
YM Futures Trader
No trade tonight..
