Get 40% Off
💰 Buffett reveals a $6.7B stake in Chubb. Copy the full portfolio for FREE with InvestingPro’s Stock Ideas toolCopy Portfolio

Trading Take-Two Interactive's Breakout

Published 05/26/2016, 01:33 PM
Updated 05/14/2017, 06:45 AM
TTWO
-

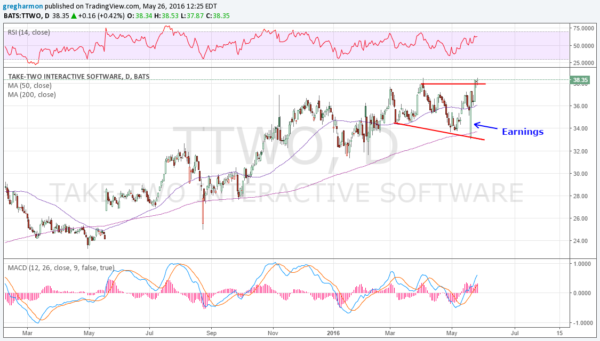
Take-Two Interactive Software (NASDAQ:TTWO) has been moving higher since the beginning of 2013. There have been periods of consolidation along the way, which have proven to be good entry points. One such point happened last week. On May 18 the company reported earnings after the close. The next day the stock opened down over 10%. But it climbed all day ending up over 4% on the day. The chart below shows the long green candle.

Notice that the candle touched below the 200-day SMA. If you follow the 200-day back, you see a couple of touches and very little time spent under that level. Each touch has been a buying opportunity. So if this was the sign to enter why am I talking about it today? Because there are many ways to trade. A second method is to trade a break above resistance.

Take Two Interactive

That break is happening right now. The upper end of the main part of the chart shows price breaking resistance. This gives a natural stop loss to trade against -- the breakout level. So if you missed the 200-day SMA this time, consider the breakout trade. Momentum remains strong and bullish with the RSI and MACD both rising. If the breakout fails, stop the trade for a small loss and put in a bid to buy at the 200-day SMA.

Latest comments

Risk Disclosure: Trading in financial instruments and/or cryptocurrencies involves high risks including the risk of losing some, or all, of your investment amount, and may not be suitable for all investors. Prices of cryptocurrencies are extremely volatile and may be affected by external factors such as financial, regulatory or political events. Trading on margin increases the financial risks.
Before deciding to trade in financial instrument or cryptocurrencies you should be fully informed of the risks and costs associated with trading the financial markets, carefully consider your investment objectives, level of experience, and risk appetite, and seek professional advice where needed.
Fusion Media would like to remind you that the data contained in this website is not necessarily real-time nor accurate. The data and prices on the website are not necessarily provided by any market or exchange, but may be provided by market makers, and so prices may not be accurate and may differ from the actual price at any given market, meaning prices are indicative and not appropriate for trading purposes. Fusion Media and any provider of the data contained in this website will not accept liability for any loss or damage as a result of your trading, or your reliance on the information contained within this website.
It is prohibited to use, store, reproduce, display, modify, transmit or distribute the data contained in this website without the explicit prior written permission of Fusion Media and/or the data provider. All intellectual property rights are reserved by the providers and/or the exchange providing the data contained in this website.
Fusion Media may be compensated by the advertisers that appear on the website, based on your interaction with the advertisements or advertisers.
© 2007-2024 - Fusion Media Limited. All Rights Reserved.