For the 7th time this year, the S&P 500 Index closed the week at new All-Time Highs.
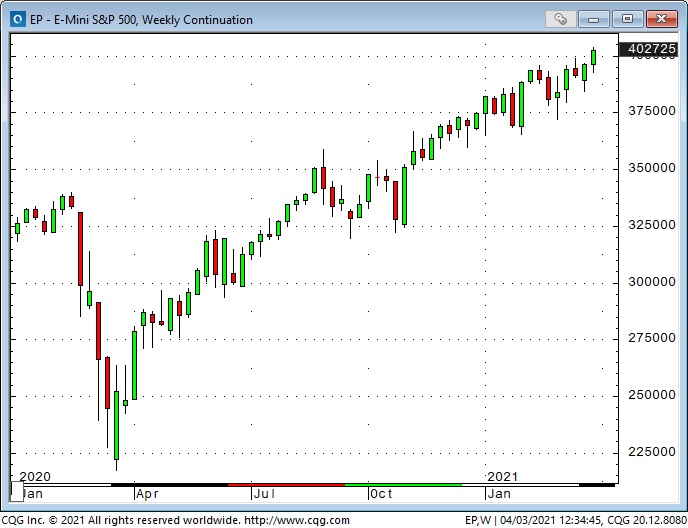
The vaccine-driven re-opening surge remains the primary market narrative with solid support from 1) another massive government spending proposal, 2) massive capital flows ($320 Billion into equity ETFs since the election,) 3) huge job creation in the USA (1.6 million new jobs YTD,) and even if the stimmy checks aren’t going into the market, don’t worry, 4) buybacks are back, and they’re bigger than ever!
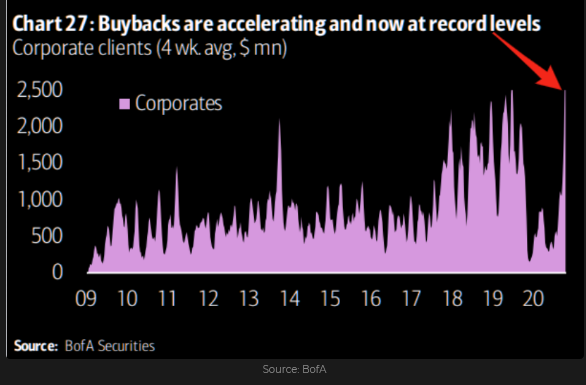
What, me worry?
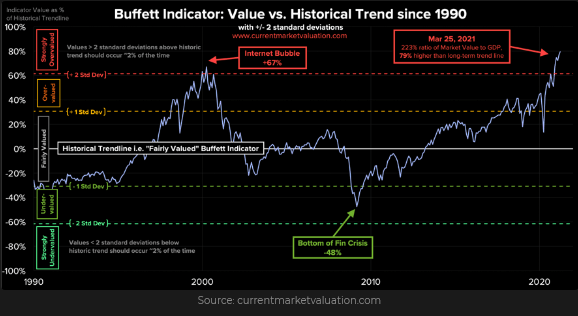
Archegos and Greensills gave the market a little flutter of concern—in terms of how many more frauds or over-leveraged players are lurking out there—but markets quickly forgot that concern. After all, we live in a world of rising consumer confidence, surging real estate prices, even air travel is coming back strong.
However, a runaway bull market will ALWAYS be a wonderful environment for frauds and over-leveraged players. And as Warren Buffett says, we will never know who’s been swimming naked until the tide goes out!
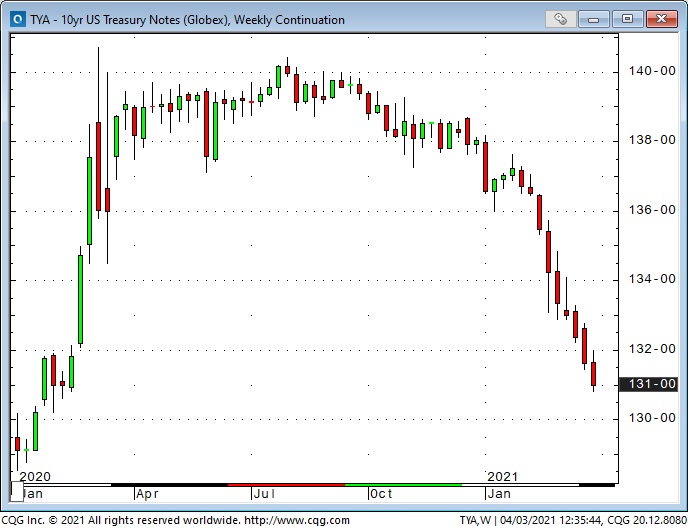
Interest rates keep chugging higher
Supply chain problems seem to be showing up everywhere = higher imput prices = higher consumer prices = rising inflation expectations. Eurodollar Futures are pricing in 2 X 0.25 interest rate increases before the end of 2022, and the bond market had its worst quarter since 1980. (In this 10-yearTreasury chart falling prices = rising interest rates.)
The US dollar bounced back after hitting a 2 1/2 year low in January.
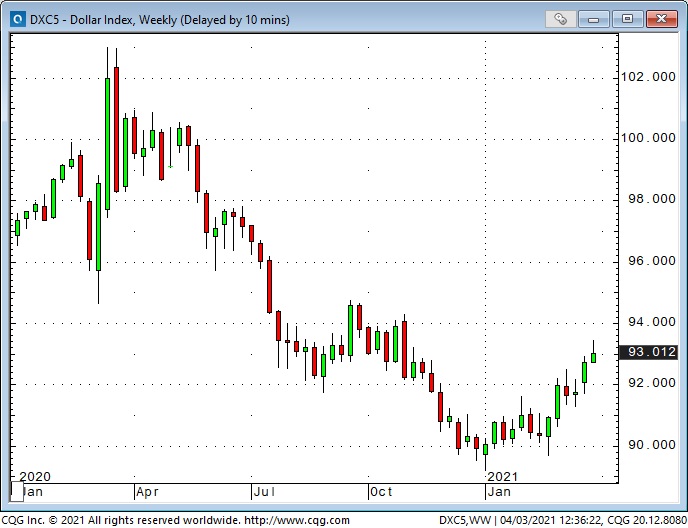
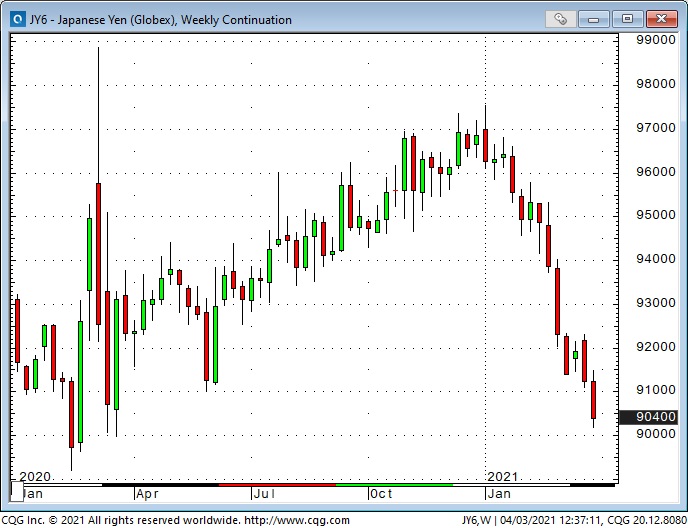
“Everybody” was bearish the USD at the beginning of 2021 after it had fallen ~13% from the panic highs made last March. But since the first week of January, the US Dollar Index is up ~4%, with most of those gains coming against the European currencies (ex. the British pound and the Japanese yen.
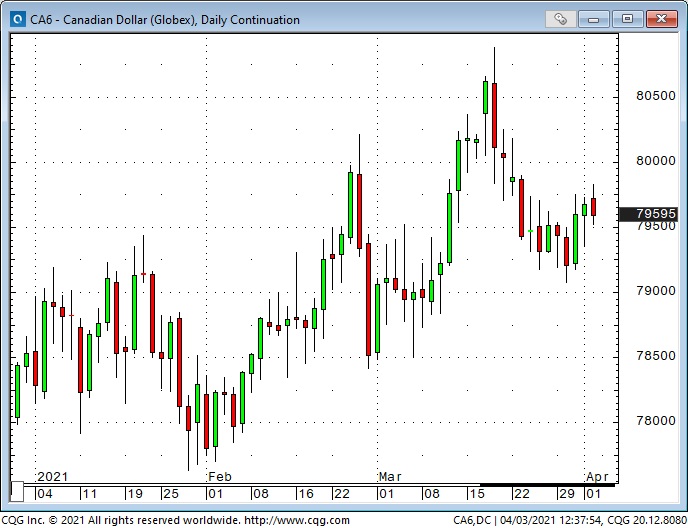
The commodity currencies fared better against the USD (the CADand the AUD hit 3-year highs in Q1) as commodity markets were bid aggressively.
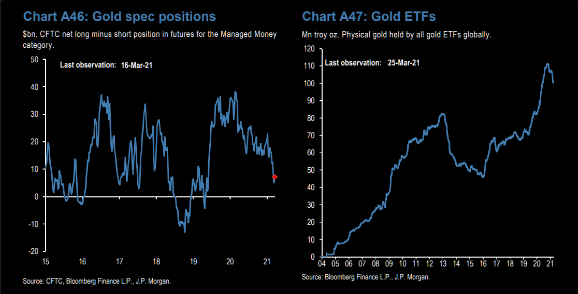
Gold fell as the US dollar and interest rates rose
Rising nominal interest rates and rising real interest rates, together with a stronger USD created a toxic environment for gold in Q1, even though inflation expectations rose sharply. In another sense, gold was “ignored” as hot money chased “things that were going up,” which was pretty much everything except gold!
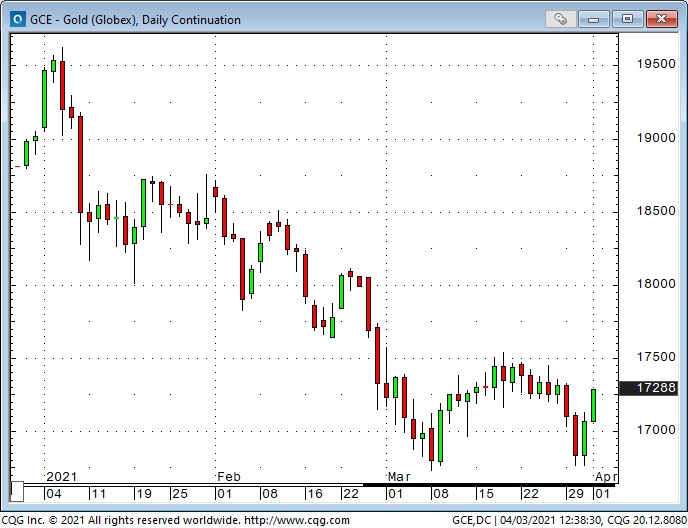
Gold seemed to find support in March around the 9-month low of $1675 and popped ~$55 late last week.
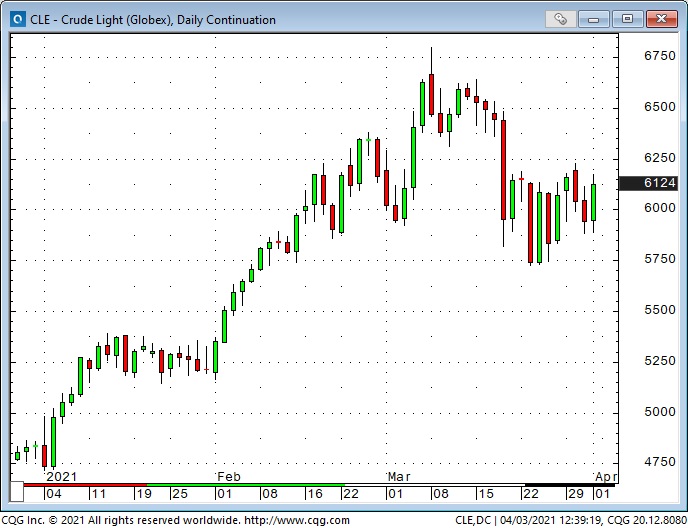
OPEC+ agrees to gradually increase production beginning in May
OPEC+ agreed to phase in a production increase of ~2MBD between May and July. This increase includes a rollback of Saudi’s voluntary 1MBD cut. WTI price rose ~$2 to ~$62.50 on the agreement, which is ~$5 below the 26-month high made Mar. 8, 2021.
Commodity indices “took a rest” after more than doubling from the 18 year lows made March 2020.
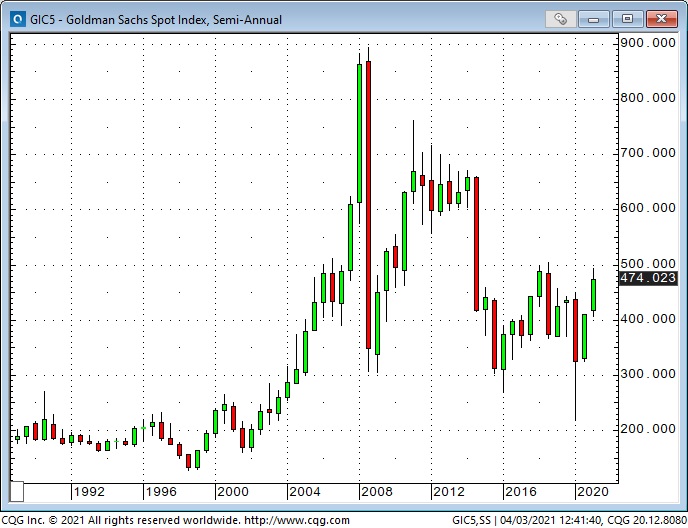
During the virus-induced market panic of March 2020, the major commodity indices hit 18-year lows. Now the talk is about “The Commodity Super Cycle.” I believe the commodity indices began a new bull market at last year’s lows, but I’m not at all surprised that copper, the Australian Dollar and the NASDAQ all topped within days of one another in mid-March. I think the commodity rally has simply been part of the “everything rally” and was bid too high, too fast and will be a “better buy” once we see a good correction.
My short term trading
Since mid-March, I have been essentially buying the USD and shorting US stock indices. That worked well, but at the end of last week, I covered a short Russell position because the market rallied Thursday and Friday—I wrote that a market rallying on a Thursday and Friday probably opens higher come Monday.
Over last weekend I read a wonderful analysis of the Archegos debacle by my friend, Kevin Muir in The Macrotourist. One of his points was that Archegos had probably hedged some of its massive bullish stock positions by shorting stock index futures.
The prime brokers who were blowing out the stock positions were probably also buying back the short hedges—hence the strong rally in stock indices in the last 2 hours of Friday, Mar. 26. That made such great sense that I re-established my short Russell position as soon as the market re-opened Sunday afternoon.
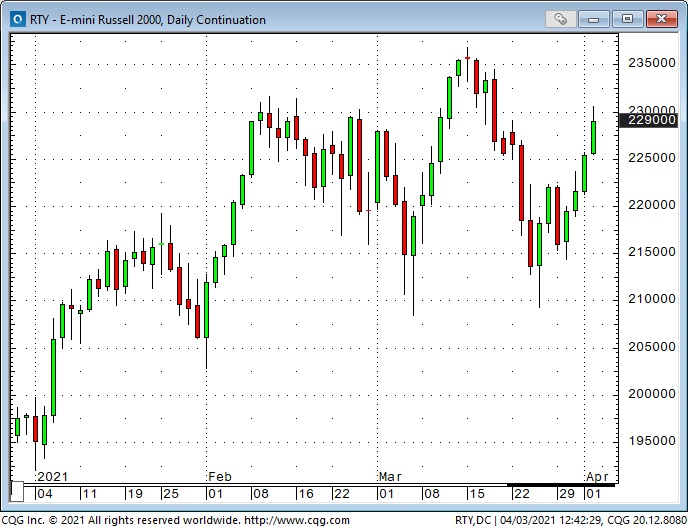
The Russell fell Sunday/Monday, but the broader market didn’t, so I covered the trade for a small gain. I also wanted to disengage from the market because I knew I would be away from my trading desk Wednesday to Friday (family issues), and the only position I maintained was long CAD puts.
On my radar
The Canadian Dollar put position went against me a little at the end of the week. If the CAD doesn’t take out this past week’s lows soon, I will liquidate the puts. If it does take out the lows, I may add to the position.
I’ve made some money shorting stock indices YTD, but it sure would have been easier to make money on the long side! I’ve underestimated the power of the rally. That doesn’t mean I’m going to be a buyer at All-Time Highs, but I will be cautious if I think I see another shorting opportunity!
