EUR/USD – Long Trade In Play, Bullish Bias Above 1.3580
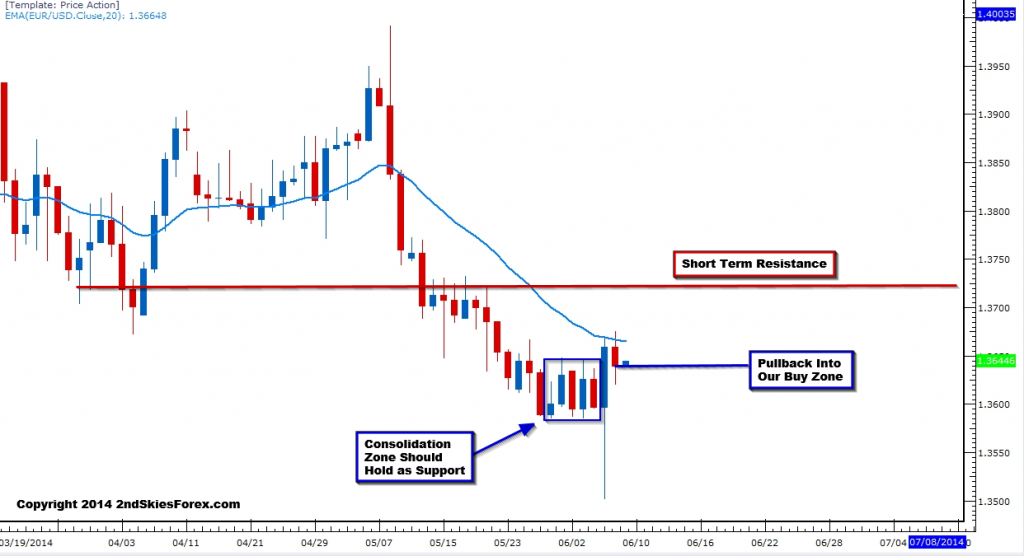
After the long tailed pin bar that we discussed last Thursday, the euro pulled back a little bit towards the top of the consolidation zone, which was natural after such a large bullish bar. Our buy zone was between 1.3615 and 1.3645, so anyone who was looking to get long should be long by now. Resistance short term comes in at Friday’s highs around 1.3676. As long as 1.3580 holds, we’ll remain bullish.
Our Trade Idea: Holding current longs, looking for a break of 1.3676 with first target around 1.3745, and a second target around 1.3830, while the potential remains for a larger reversal up to 1.3890. If you are not currently long, look for a weak pullback into the 1.3620/1.3585 support zone.
NZD/USD – Pin Bar At Role Reversal Level
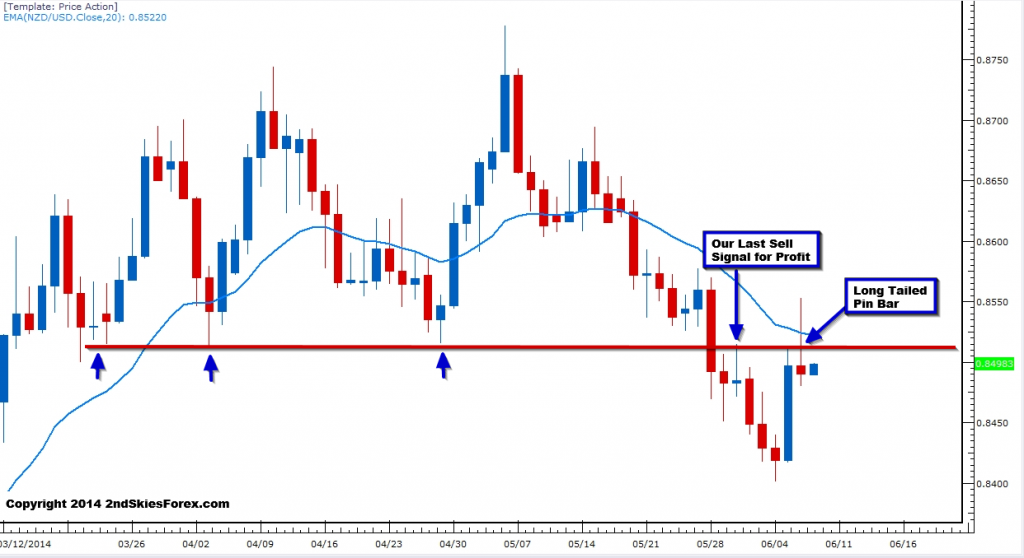
The Kiwi reversed a lot of the bearish momentum lately in two days that took out the last 6 of selling. In this process, the pair formed a pin bar at a role reversal level, the same one we traded last week and profited from in 8515. This time, I’m going to pass on the trade (for now) as the pair has a lot of short term momentum in its favor, and the pin bar high took out the level by +35 pips, suggesting it wasn’t respecting it (or if it was, it was able to make deep in-roads into the sellers there before rejecting lower).
Our Trade Idea: Waiting to see how price action unfolds at the level. If strength persists, then I’ll look to get long above 8515 assuming this level has been ‘recovered’. If the intra-day price action weakens and has a hard time getting past it, then I’ll be open to sell there, but need more development to short in front of this current momentum.
Gold – Both Intra-Day Buy Levels Hold For Profit
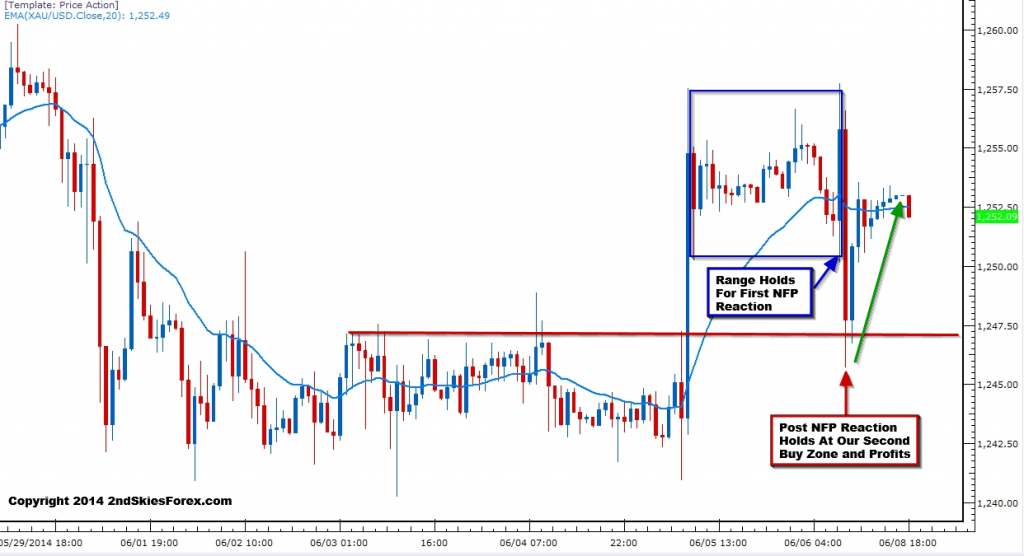
In our members commentary on Thursday, we suggested looking to buy on pullbacks, with short term traders looking to play the range between 1251 and 1257, while more conservative traders waiting for a pullback into 1245. The range in fact held the first NFP dip, and subsequently never went below 1250, while hitting the 1257 target inside an hour.
Then after rejecting here, the precious metal dipped down to our 1245 buy zone, which held, never going below 1245, and then rocketed higher into the close to 1252. Many of you members emailed me with your trades and profits on this, so nicely done. (I’ll confess, I only caught the first one, and missed the second one).
Our Trade Ideas: For now, I’m remaining cautiously bullish while we are above 1240, wherein a close below here would turn my bias short and medium term back to bearish. I am open to buying on corrective pullbacks into the 1245/1240 zone. Upside levels to watch are 1257, 1260 and 1275. Bears meanwhile can watch the price action to sell at 1277 for a move lower to 1260/1257.


