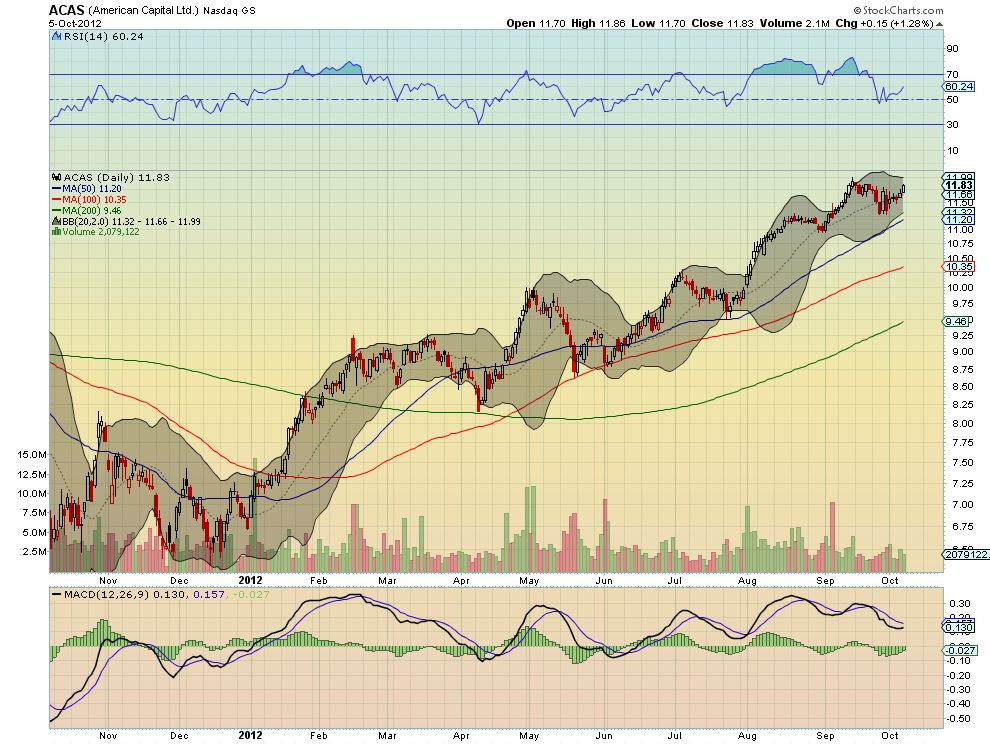
American Capital (ACAS) is moving higher after a retest at the 20 day Simple Moving Average (SMA) toward the previous high at 12. It has support for a continued move higher from a rising and bullish Relative Strength Index (RSI) and a Moving Average Convergence Divergence indicator (MACD) that is about to cross to positive. The Measured move higher takes it to 12.30 but the 3-box reversal Point and Figure chart (PnF) has a price objective much higher at 22.75.
Asiainfo Linkage (ASIA)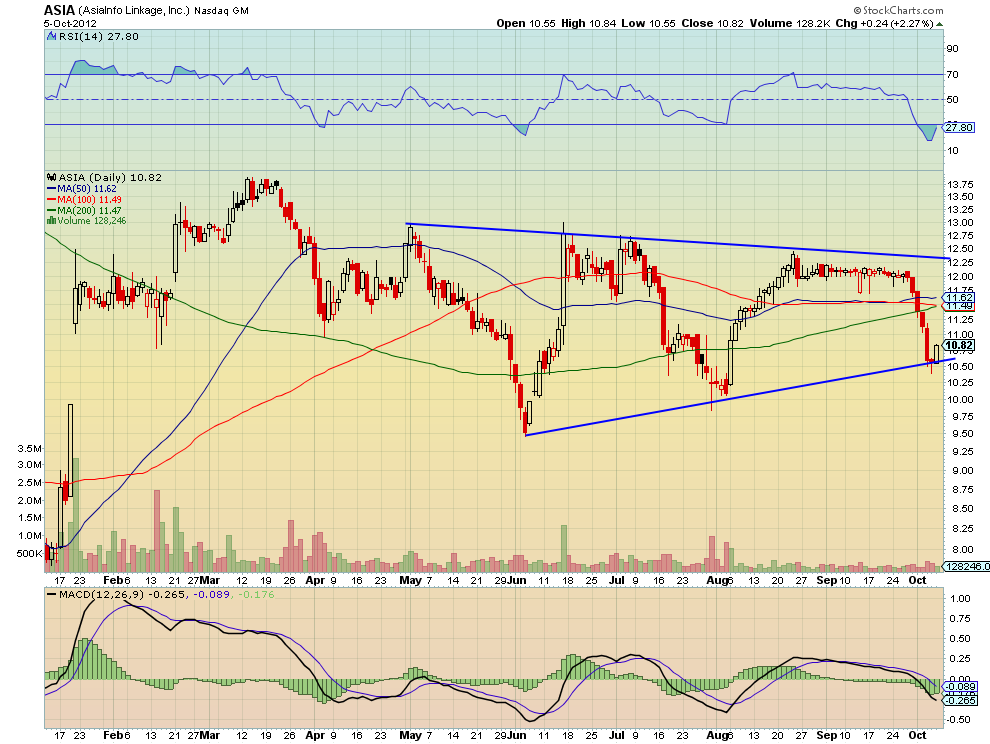
Asiainfo Linkage (ASIA) has been moving in a symmetrical triangle since May. The latest hold of support on the base and move higher comes with a RSI that is moving from an extreme oversold condition on the RSI higher. The MACD is also starting to improve.
Allscripts Healthcare Solutions (MDRX)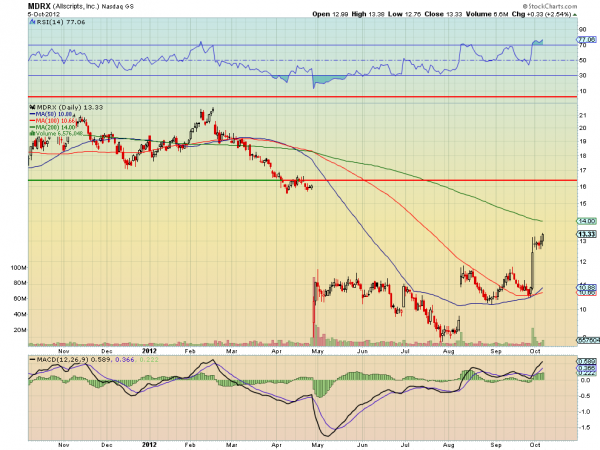
Allscripts Healthcare Solutions (MDRX) moved out of consolidation and into the gap on Friday. The gap fill higher comes at 15.81, but the PnF price objective is even higher at 21.50. The RSI is technically overbought so long positions need to be cautious, but it remains bullish and the MACD is supportive for more upside, too.
Southwestern Energy (SWN)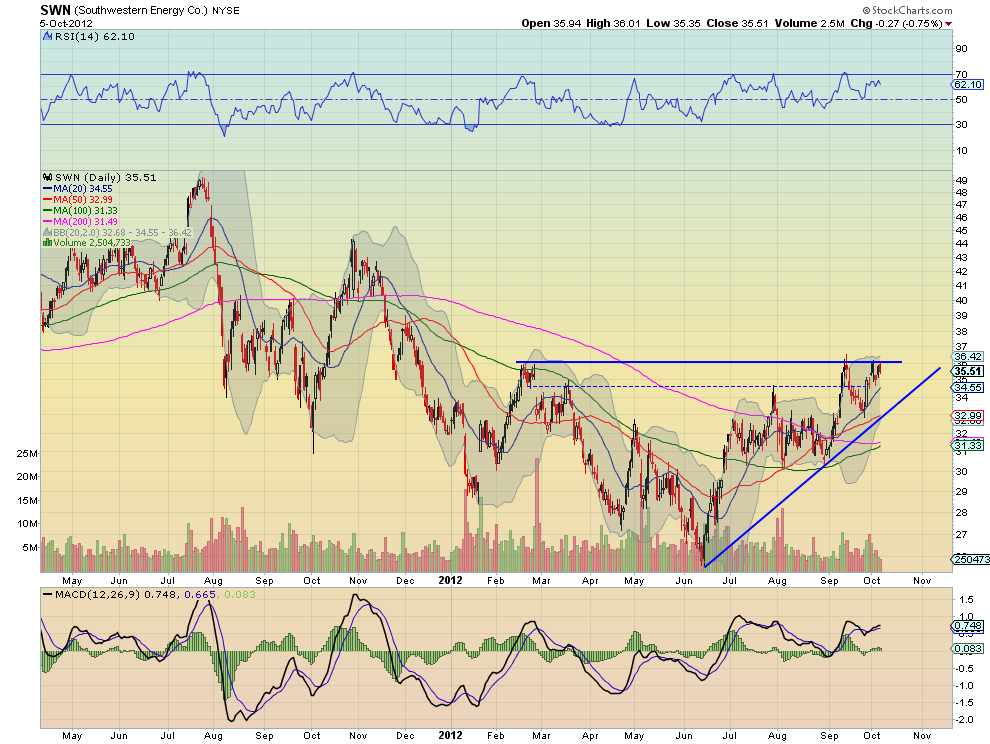
Southwestern Energy (SWN) is working within two nested Inverse Head and Shoulders patterns. After breaking the dotted neckline and now moving back higher it is about to break the larger neckline. The price objectives of the two are 43.65 and 47.15 and the PnF sees it potentially higher at 51. The bullish RSI and the positive MACD support more upside for a push higher.
Valeant Pharmaceuticals (VRX)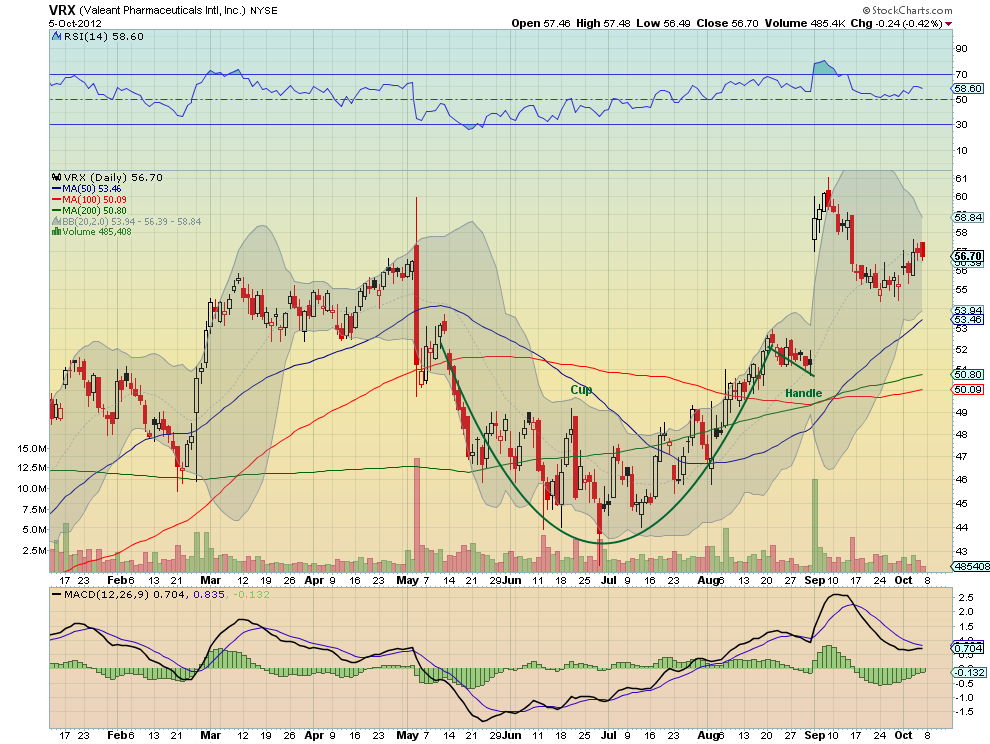
Valeant Pharmaceuticals (VRX) did not give a chance to enter when it jumped higher from a Cup and Handle after Labor Day. But after the recent pullback it presents an interesting trading opportunity with the bearish engulfing candle Friday. A continued move higher over Friday’s high could continue the run to the previous high at 61.11 while a confirmation of the bearish engulfing candle would see look for a gap fill lower. The RSI is bullish and trending higher while the negative MACD is is improving, both supporting the upside.
After reviewing over 1,000 charts, I have found some good setups for the week. These were selected and should be viewed in the context of the broad Market Macro picture reviewed Saturday which, heading into next week suggest keeping an eye on volatility as a signal for a turn, with the expectation that it will remain subdued. Gold looks to be set up to move lower short term but remain bullish longer term while Crude Oil looks lower, and may be seeking a bottom nearby.
US Treasurys are set up to continue lower while the Dollar Index may continue to consolidate but is also biased lower. The Shanghai Composite starts trading again with a bias to continue the bounce within the downtrend from before the holiday while Emerging Markets consolidate at resistance. These all set up for the US Equity Index ETF’s, SPY, IWM and QQQ to continue higher. The charts of the Indexes themselves agree with the bias but show signs of consolidation or a short pullback. Use this information as you prepare for the coming week and trade’m well.
Disclaimer: The information in this blog post represents my own opinions and does not contain a recommendation for any particular security or investment. I or my affiliates may hold positions or other interests in securities mentioned in the Blog, please see my Disclaimer page for my full disclaimer.
Original post
