Many investors and traders make the same mistakes assuming that one needs a complex trading system to consistently profit from the stock market. On the contrary, some of the top performing strategies are the ones with the least amount of moving parts and are simple. Because their simplicity they can be easily and consistently followed.
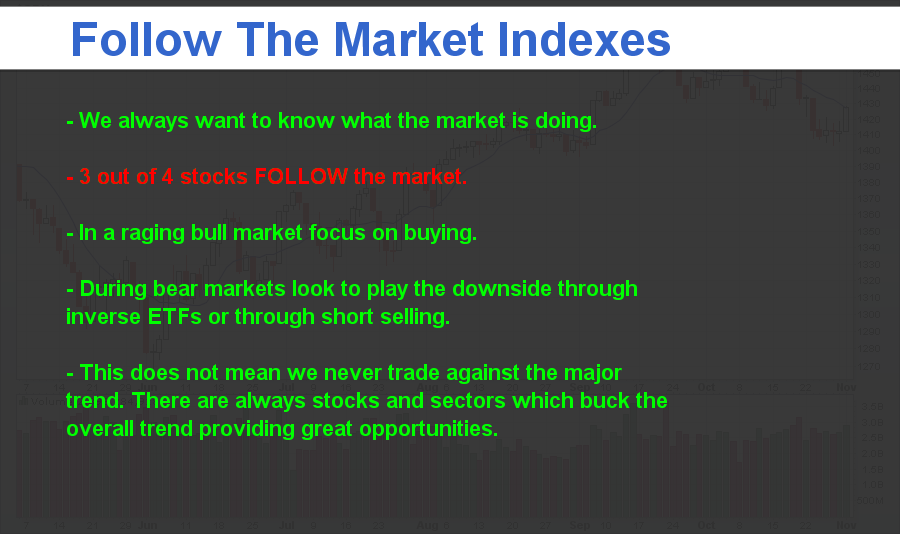
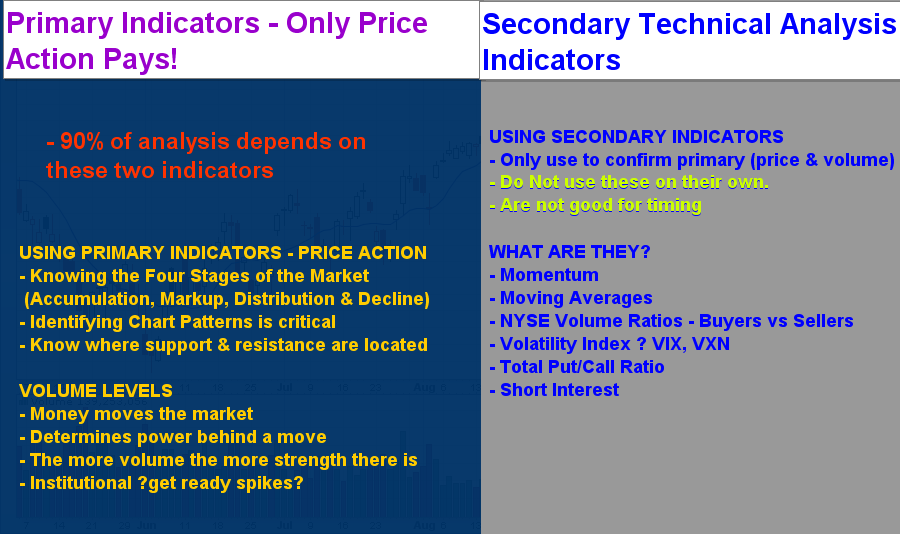
The methodologies we use for timing the market, picking stocks and option trades are very simple because we focus mainly on price, volume and momentum. These three indicators are the key to success. When these are used together you are able time your entries and exits during key turning points, clearly define risk and reward levels while maintaining a clear unbiased state of mind which allows one to trade almost emotionless.
As my Trading System Mastery coach (Brian McAboy) taught me, if you do not have a detailed trading plan which a five year old could trade, then you do not have a solid strategy and will have unnecessary losses and emotional stress.
So here are a couple tips to keep things simple and emotionless:


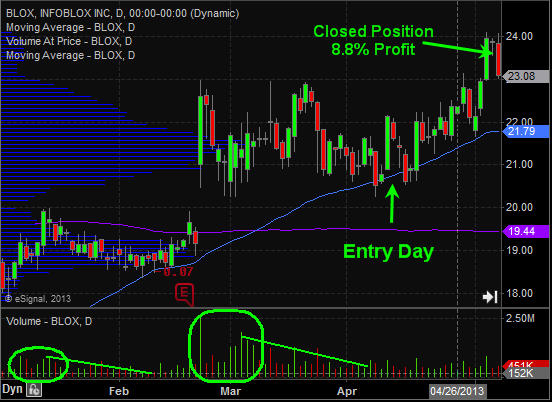
Our recent trade in Infoblox Inc. (BLOX) with our ActiveTradingPartners Newsletter:
This stock was flashing several signals (price, volume and momentum) that a bounce or rally was likely going to happen within a few weeks. This is a good example of a swing trade based purely on our main indicators.
Our Broad Market Outlook:
Current stock market prices are starting to warn us that a market correction is near. You can read more about this in detail in our last report “Stocks Preparing for a Pullback, Buy Bas News, Sell the Good”.
We all know the market works with the saying:
“If the market doesn’t shake you out, it will wait you out”.
How does this work? Simple really, during down trends and just before a market bottom we tend to see capitulation spikes in selling. These scare the last of the long positions out of the market and suck in the greedy shorts after the move has already been made.
During an uptrend which is what we are in now the market makes spike highs designed to scare out the shorts and get greedy long traders to buy more. Once again after the move has already been made and likely near the market top.
If you are the type of trader who always tries to pick tops and bottoms against the current trend then you may like to know this little tip… The largest percent moves typically happen during the last 75% of the trend. What does this mean? It means when you take your position against the trend trying to pick the dead top or bottom you are most likely going to get be caught on the wrong side of the market in a big way.
Most traders I know based on recent emails have been short the market for 1-3 weeks and many keep emailing me that they are adding more shorts each day because they feel the market is going to top. So me being a contrarian by nature in terms of what the masses are doing, if everyone is still holding on to their shorts we likely have not seen the top just yet. Another 1-2% jump from here should be enough to shake them out though…
- English (UK)
- English (India)
- English (Canada)
- English (Australia)
- English (South Africa)
- English (Philippines)
- English (Nigeria)
- Deutsch
- Español (España)
- Español (México)
- Français
- Italiano
- Nederlands
- Português (Portugal)
- Polski
- Português (Brasil)
- Русский
- Türkçe
- العربية
- Ελληνικά
- Svenska
- Suomi
- עברית
- 日本語
- 한국어
- 简体中文
- 繁體中文
- Bahasa Indonesia
- Bahasa Melayu
- ไทย
- Tiếng Việt
- हिंदी
Top 3 Trading Indicators For Profitable & Simple Trading
Published 05/10/2013, 12:45 AM
Updated 07/09/2023, 06:31 AM
Top 3 Trading Indicators For Profitable & Simple Trading
3rd party Ad. Not an offer or recommendation by Investing.com. See disclosure here or
remove ads
.
Latest comments
Install Our App
Risk Disclosure: Trading in financial instruments and/or cryptocurrencies involves high risks including the risk of losing some, or all, of your investment amount, and may not be suitable for all investors. Prices of cryptocurrencies are extremely volatile and may be affected by external factors such as financial, regulatory or political events. Trading on margin increases the financial risks.
Before deciding to trade in financial instrument or cryptocurrencies you should be fully informed of the risks and costs associated with trading the financial markets, carefully consider your investment objectives, level of experience, and risk appetite, and seek professional advice where needed.
Fusion Media would like to remind you that the data contained in this website is not necessarily real-time nor accurate. The data and prices on the website are not necessarily provided by any market or exchange, but may be provided by market makers, and so prices may not be accurate and may differ from the actual price at any given market, meaning prices are indicative and not appropriate for trading purposes. Fusion Media and any provider of the data contained in this website will not accept liability for any loss or damage as a result of your trading, or your reliance on the information contained within this website.
It is prohibited to use, store, reproduce, display, modify, transmit or distribute the data contained in this website without the explicit prior written permission of Fusion Media and/or the data provider. All intellectual property rights are reserved by the providers and/or the exchange providing the data contained in this website.
Fusion Media may be compensated by the advertisers that appear on the website, based on your interaction with the advertisements or advertisers.
© 2007-2024 - Fusion Media Limited. All Rights Reserved.
